

The SSD Review uses PCMark 8’s Storage test suite to create testing scenarios that might be used in the typical user experience. With 10 traces recorded from Adobe Creative Suite, Microsoft Office and a selection of popular games, it covers some of the most popular light to heavy workloads. Unlike synthetic storage tests, the PCMark 8 Storage benchmark highlights real-world performance differences between storage devices. After an initial break-in cycle and three rounds of the testing, we are given a file score and bandwidth amount. The higher the score/bandwidth, the better the drive performs.
PCMARK 8 STORAGE RESULTS
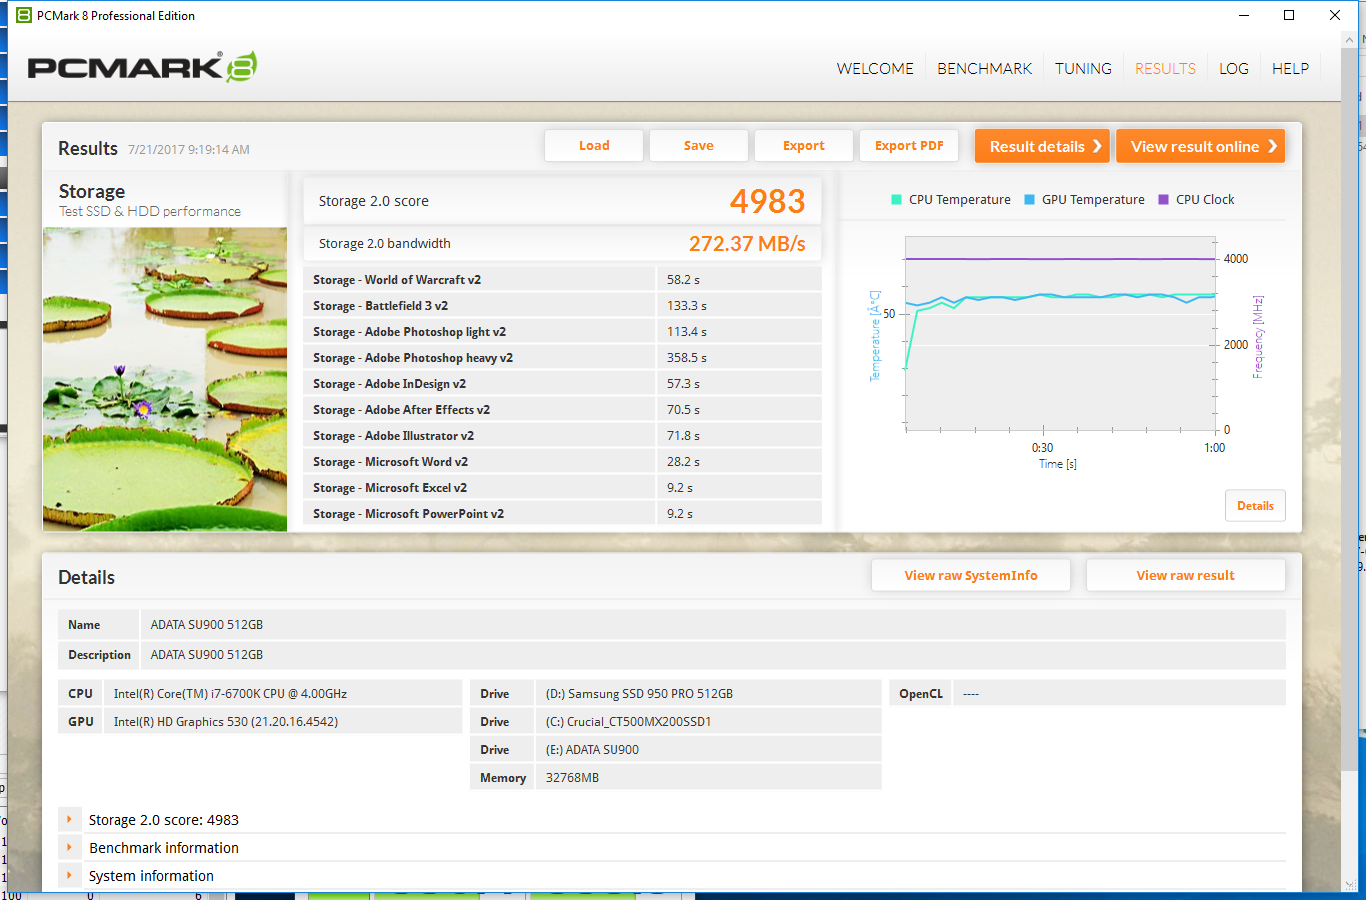
In PCMark 8 the ADATA Ultimate SU900 scored 4983 points and averaged 272MB/s in bandwidth.
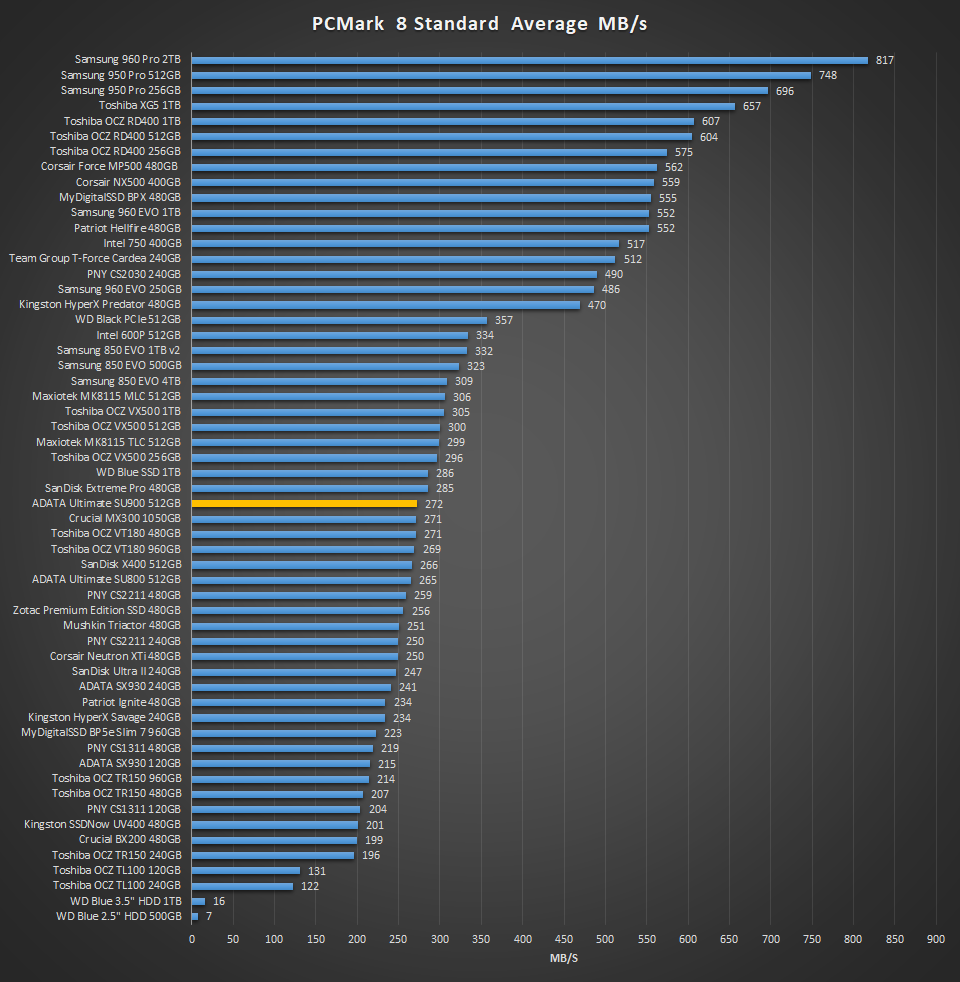
This score places it around the middle of the chart, which is nearly near some of the top performing SATA SSDs in the market. Its performance is just ahead of the 1TB Crucial MX300 and just under the SanDisk Extreme Pro.
PCMARK 8 EXTENDED STORAGE WORKLOAD CONSISTENCY TESTING
For our last benchmark, we have decided to use PCMark 8 Extended Storage Workload in order to determine steady state throughput of the SSD. This software is the longest in our battery of tests and takes just under 18 hours per SSD. As this is a specialized component of PCMark 8 Professional, its final result is void of any colorful graphs or charts typical of the normal online results and deciphering the resulting excel file into an easily understood result takes several more hours.
There are 18 phases of testing throughout the entire run, 8 runs of the Degradation Phase, 5 runs of the Steady State Phase and 5 runs of the Recovery Phase. In each phase, several performance tests are run of 10 different software programs; Adobe After Effects, Illustrator, InDesign, Photoshop Heavy and Photoshop Light, Microsoft Excel, PowerPoint and Word, as well as Battlefield 3 and World of Warcraft to cover the gaming element.
- PRECONDITIONING -The entire SSD is filled twice sequentially with random data of a 128KB file size. The second run accounts for overprovisioning that would have escaped the first;
- DEGRADATION PHASE – The SSD is hit with random writes of between 4KB and 1MB for 10 minutes and then a single pass performance test is done of each application. The cycle is repeated 8 times, and with each time, the duration of random writes increases by 5 minutes;
- STEADY STATE PHASE – The drive is hit with random writes of between 4KB and 1MB for 45 minutes before each application is put through a performance test. This process is repeated 5 times;
- RECOVERY PHASE – The SSD is allowed to idle for 5 minutes before and between performance tests of all applications. This is repeated 5 times which accounts for garbage collection; and
- CLEANUP – The entire SSD is written with zero data at a write size of 128KB
In reading the results, the Degrade and Steady State phases represent heavy workload testing while the recovery phase represents typical consumer light workload testing.
As you can see, performance is recorded in terms of Bandwidth and Latency. Bandwidth (or throughput) represents the total throughput the drive is able to sustain during the tests during each phase. Latency, at least for the purposes of PCMark 8, takes on a different outlook and for this, we will term it ‘Total Storage Latency’. Typically, latency has been addressed as the time it takes for a command to be executed, or rather, the time from when the last command completed to the time that the next command started. This is shown below as ‘Average Latency’.
PCMark 8 provides a slightly different measurement, however, that we are terming as ‘Total Storage Latency’. This is represented as being the period from the time the last command was completed, until the time it took to complete the next task; the difference of course being that the execution of that task is included in ‘Total Storage Latency’. For both latency graphs, the same still exists where the lower the latency, the faster the responsiveness of the system will be. While both latency charts look very similar, the scale puts into perspective how just a few milliseconds can increase the length of time to complete multiple workloads.
For a more in-depth look into Latency, Bandwidth, and IOPS check out our primer article on them here.
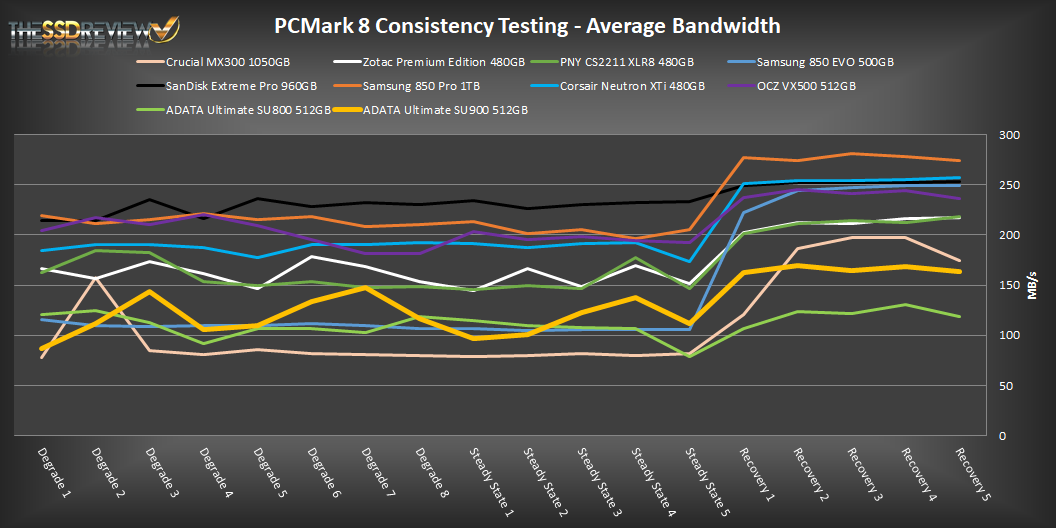
AVERAGE BANDWIDTH (OR THROUGHPUT)
These results show the total average bandwidth across all tests in the 18 phases. In this graph the higher the result the better.
AVERAGE LATENCY (OR ACCESS TIME)
These results show the average access time during the workloads across all tests in the 18 phases. In this graph the lower the result the better.
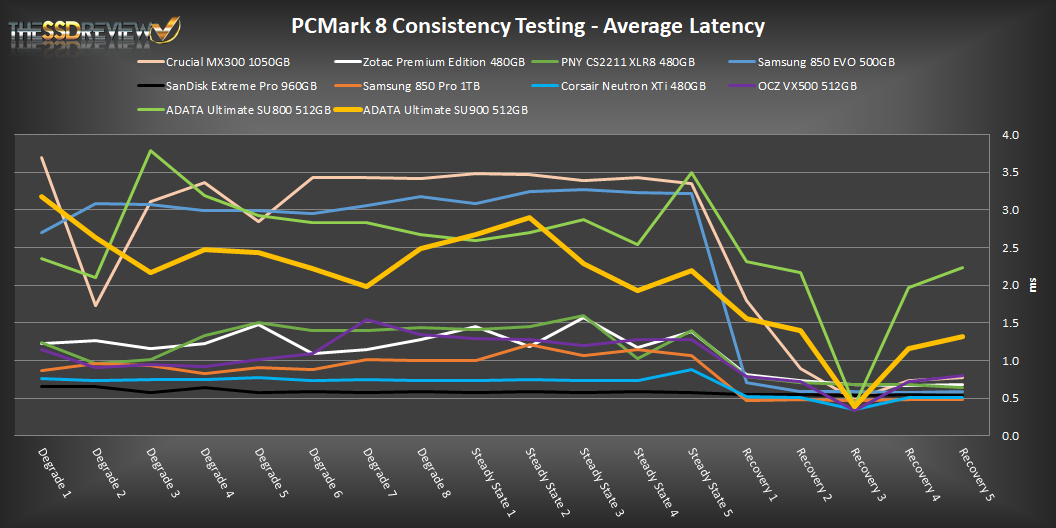
In PCMark 8’s extended testing the ADATA SU800 showed extremely similar results to that of the SU800 before it. This time around the SU900 delivered better performance, but its results are still low compared to most other drives we have tested after the steady state portion. It seems to have the same issue with recovering from a heavy workload that the SU800 has.
Is this the same as the crucial bx300?
does not look like it in performance tests. Do you think they modded the driver ?
Can I trust the 400TBW endurance rating as stated in SU900’s spec? Some tech geeks that I know on online forums and in RL still recommends Samsung Evo over Adata, calling the latter “bottom tier hardware”.
First of all, I wish everyone a good day. I stayed between two SSDs: A-Data SU900 512GB and Samsung 860 Evo 500GB SATA III. A-Data MLC, Samsung TLC (3-bit MLC said Samsung). What are your comments?