

SNIA IOPS TESTING
The Storage Networking Industry Association has an entire industry accepted performance test specification for solid state storage devices. Some of the tests are complicated to perform, but they allow us to look at some important performance metrics in a standard, objective way.
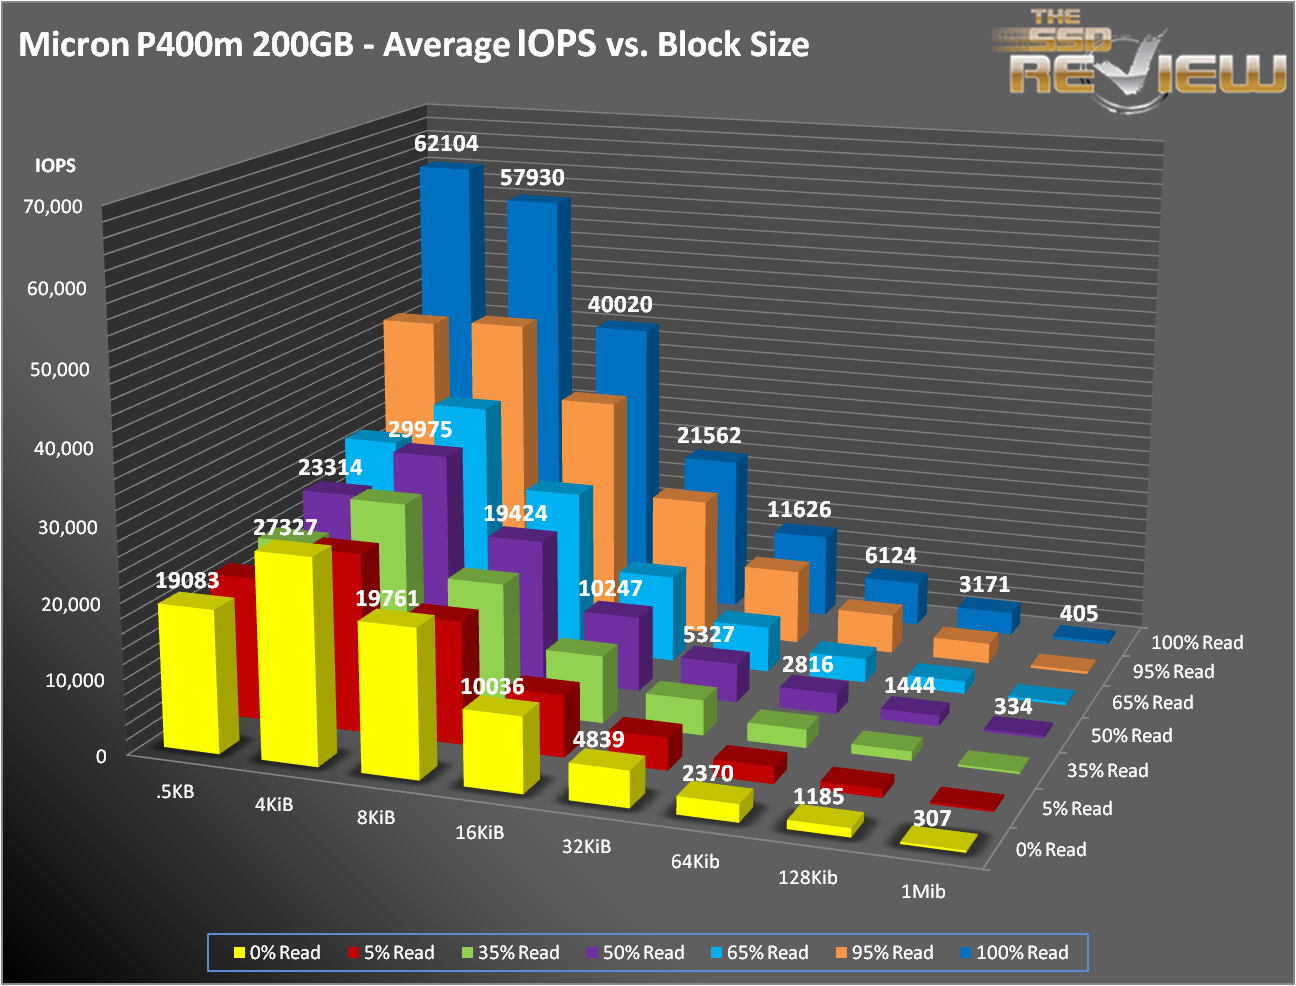
SNIA’s Performance Test Specification (PTS) includes IOPS testing, but it is much more comprehensive than just running 4KB writes with IOMeter. SNIA testing is more like a marathon than a sprint. In total, there are 25 rounds of tests, each lasting 56 minutes. Each round consists of 8 different block sizes (512 bytes through 1MB) and 7 different access patterns (100% reads to 100% writes). After 25 rounds are finished (just a bit longer than 23 hours), we record the average performance of 4 rounds after we enter steady state.
- Preconditioning: 3x capacity fill with 128K sequential writes
- Each round is composed of .5K, 4K, 8K, 16K, 32K, 64K, 128K, and 1MB accesses
- Each access size is run at 100%, 95%, 65%, 50%, 35%, 5%, and 0% Read/Write Mixes, each for one minute.
- The test is composed of 25 rounds (one round takes 56 minutes, 25 rounds = 1,400 minutes)
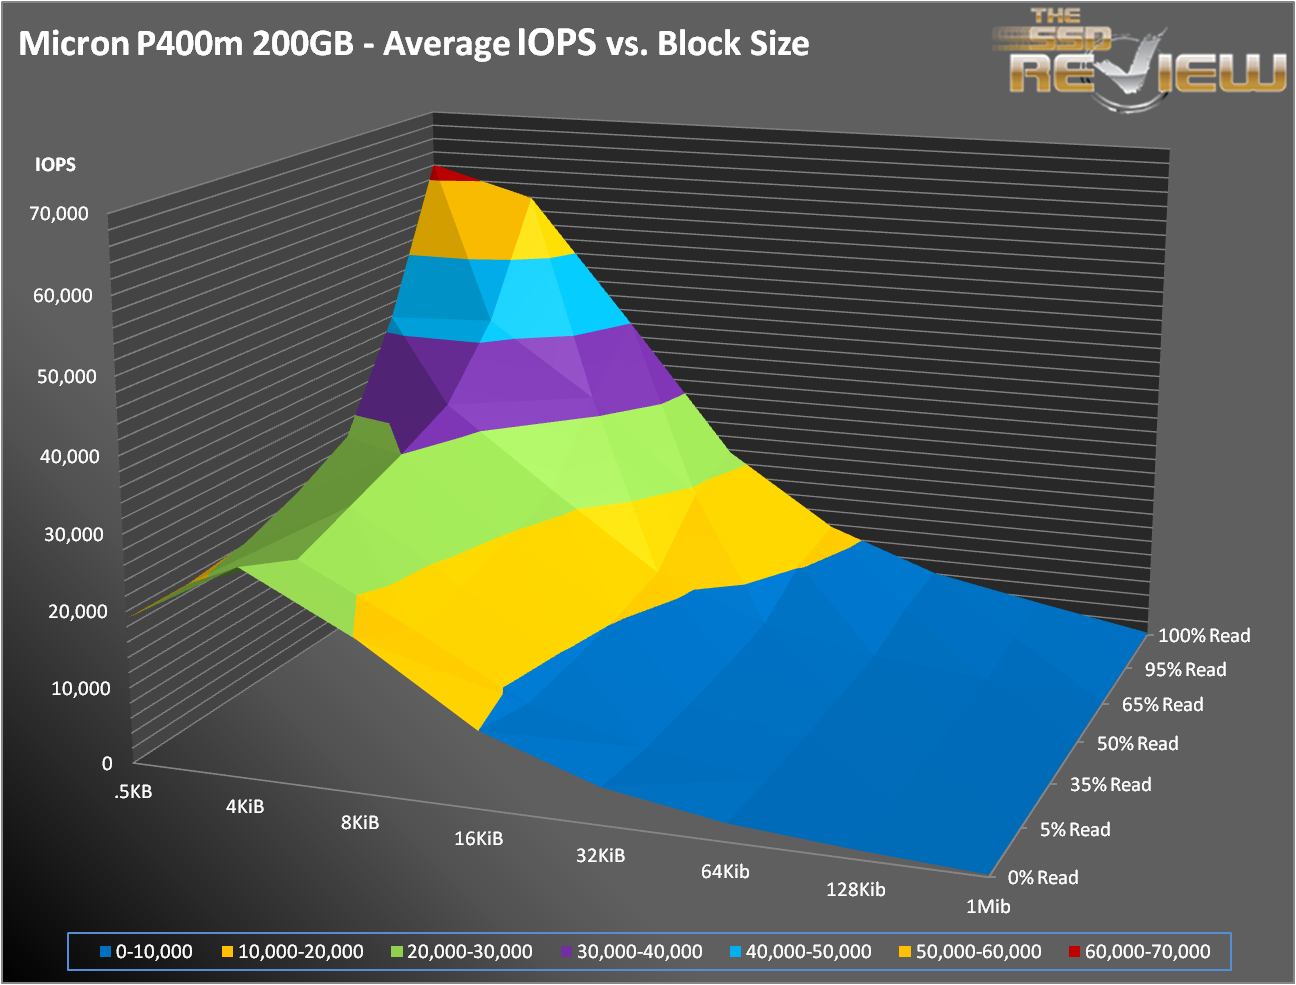
Lets take a look at the surface chart. You can get a good feeling as to how the drive performs and where its strengths and weaknesses lie. Once again, the P400m is a very well-behaved drive. As you can see from the charts above, IOPS increase as you move to the upper left. This is expected as the transfer size decreases and the percentage of writes decrease. You can also see a very prominent ridge extending across the 4KB transfer size, where performance generally decreases on either side.
Unlike our other performance tests, the SNIA tests only last for a relatively short period of time each (1 minute), but they cover many more access patterns and transfer sizes. You may have noticed that some of the SNIA results are higher or lower than in our other tests. The reason for this is because SSD performance is heavily predicated on previous workloads. Toggling between large and small blocks and reads to writes is stressful on the drive and results can vary. This is why we take the average of multiple runs. What it does show is how well a drive’s firmware can perform garbage collection, TRIM and many other internal housekeeping tasks.