
TSSDR TEST BENCH AND PROTOCOL
SSD testing at TSSDR differs slightly, depending on whether we are looking at consumer or enterprise SSDs. For consumer SSDs, our goal is to test in a system that has been optimized with our SSD Optimization Guide. To see the best performance possible the CPU C states have been disabled, C1E support has been disabled, Enhanced Intel SpeedStep Technology (EIST) has been disabled. Benchmarks for consumer testing are also benchmarks with a fresh drive so, not only can we verify that manufacturer specifications are in line but also, so the consumer can replicate our tests to confirm that they have an SSD that is top-notch. We even provide links to most of the benchmarks used in the report.
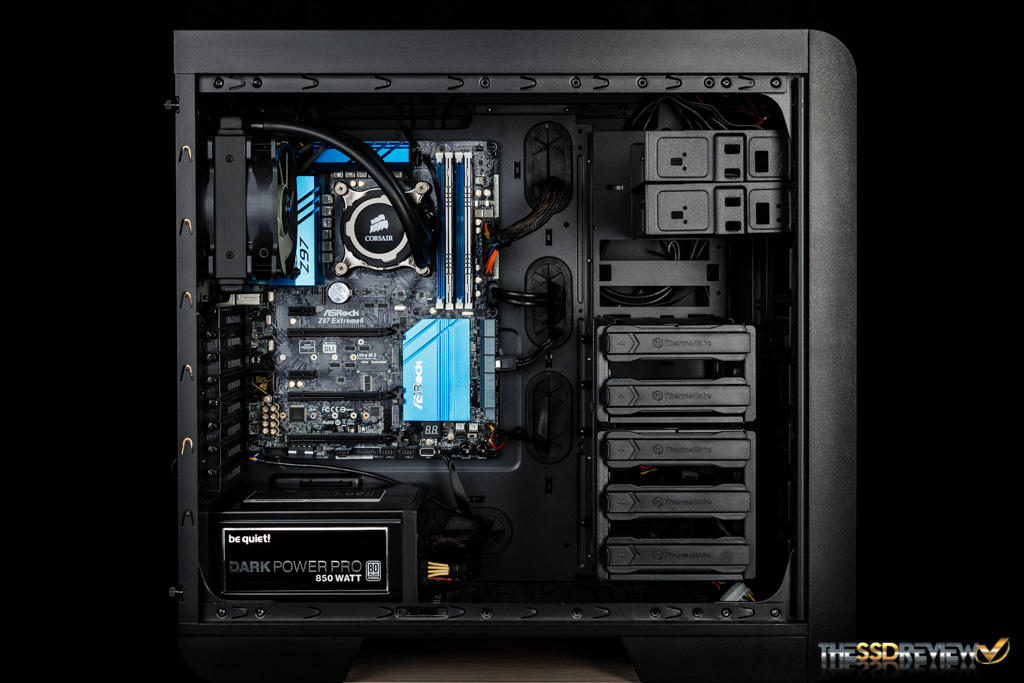
SYSTEM COMPONENTS
This Test Bench build was the result of some great relationships and purchase; our appreciation goes to those who jumped in specifically to help the cause. Key contributors to this build are our friends at ASRock for the motherboard and CPU and be quiet! for the PSU and cooling fans. Also, a big thank you to Thermaltake for the case and Kingston for the RAM. We have detailed all components in the table below and they are all linked should you wish to make a duplicate of our system as so many seem to do, or check out the price of any single component. As always, we appreciate your support in any purchase through our links!
| PC CHASSIS: | Thermaltake Core V51 |
| MOTHERBOARD: | ASRock Z97 Extreme6 |
| CPU: | Intel Core i5-4670K |
| CPU COOLER: | Corsair H75 |
| POWER SUPPLY: | be quiet! Dark Power Pro 10 850W |
| SYSTEM COOLING: | be quiet! Silent Wings 2 |
| MEMORY: | Kingston HyperX Beast 2400Mhz |
| STORAGE: | Samsung 850 Pro |
| IRST DRIVER: | 13.1.0.1058 |
BENCHMARK SOFTWARE
The software in use for today’s analysis is typical of many of our reviews and consists of ATTO Disk Benchmark, Crystal Disk Mark, AS SSD, Anvil’s Storage Utilities, PCMark Vantage, and PCMark 8. We prefer to test with easily accessible software that the consumer can obtain, and in many cases, we even provide links. Our selection of software allows each to build on the last and to provide validation to results already obtained.
ATTO Disk Benchmark is perhaps one of the oldest benchmarks going and is definitely the main staple for manufacturer performance specifications. ATTO uses RAW or compressible data and, for our benchmarks, we use a set length of 256mb and test both the read and write performance of various transfer sizes ranging from 0.5 to 8192kb. Manufacturers prefer this method of testing as it deals with raw (compressible) data rather than random (includes incompressible data) which, although more realistic, results in lower performance results.
V1

V2
ATTO results reveal that there is very little difference in performance. We can note that at smaller file sizes there is a slight improvement in the newer product over the old.
Apart from the fewer nand packages, do you think the power consumption improvement could be attributed to the controller?
The controller package seems smaller on the newer version. Do you know if it’s a new revision, or just a shrink to a new smaller node? Probably the latter i suppose, although a new revision might be needed for the 4tb model.
Hi there,
Can anyone tell me where to purchase these new 48-layer V-NAND drives? I’ve looked on Amazon and it seems they are still selling the 32 – layer versions. Anyone got a link (specifically for the 1Tb model)??
Thanks in advance.
Versions can be seen from the revised packaging: Instead of the orange lettering “Powered by 3D V-NAND Technology” now adorns a “V-NAND” lettering with blue “V” on the box.
thats why sequential minimally regressed but random improved