
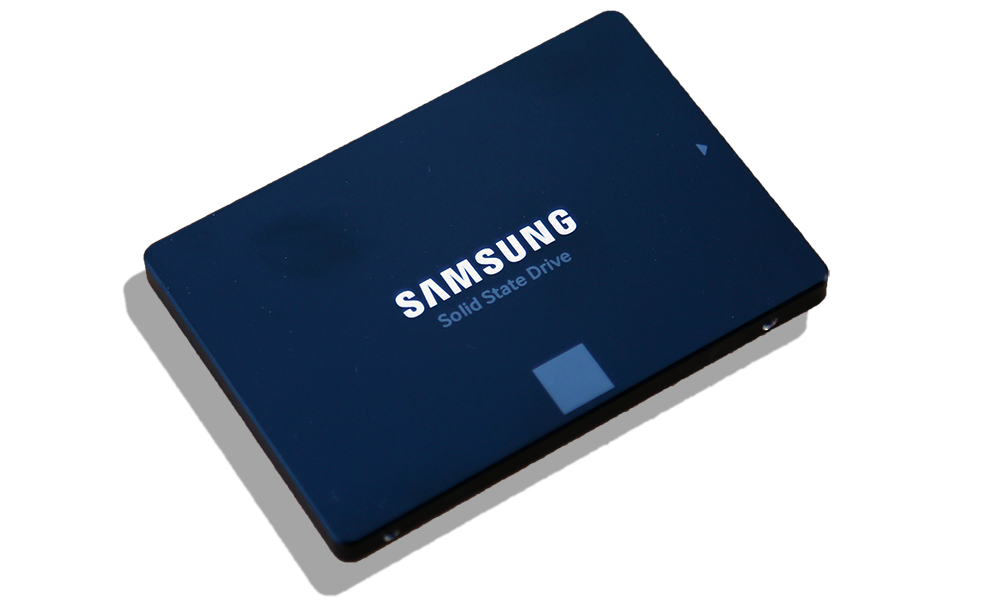
SAMSUNG 850 PRO 2TB
For our last benchmark, we have decided to use PCMark 8 Extended Storage Workload in order to determine steady state throughput of the SSD. This software is the longest in our battery of tests and takes just under 18 hours per SSD. As this is a specialized component of PCMark 8 Professional, its final result is void of any colorful graphs or charts typical of the normal online results and deciphering the resulting excel file into an easily understood result takes several more hours.
There are 18 phases of testing throughout the entire run, 8 runs of the Degradation Phase, 5 runs of the Steady State Phase and 5 runs of the Recovery Phase. In each phase, several performance tests are run of 10 different software programs; Adobe After Effects, Illustrator, InDesign, Photoshop Heavy and Photoshop Light, Microsoft Excel, PowerPoint and Word, as well as Battlefield 3 and World of Warcraft to cover the gaming element.
- PRECONDITIONING -The entire SSD is filled twice sequentially with random data of a 128KB file size. The second run accounts for overprovisioning that would have escaped the first;
- DEGRADATION PHASE – The SSD is hit with random writes of between 4KB and 1MB for 10 minutes and then a single pass performance test is done of each application. The cycle is repeated 8 times, and with each time, the duration of random writes increases by 5 minutes;
- STEADY STATE PHASE – The drive is hit with random writes of between 4KB and 1MB for 45 minutes before each application is put through a performance test. This process is repeated 5 times;
- RECOVERY PHASE – The SSD is allowed to idle for 5 minutes before and between performance tests of all applications. This is repeated 5 times which accounts for garbage collection; and
- CLEANUP – The entire SSD is written with zero data at a write size of 128KB
In reading the results, the Degrade and Steady State phases represent heavy workload testing while the recovery phase represents typical consumer light workload testing.
As you can see, performance is recorded in terms of Bandwidth and Latency. Bandwidth (or throughput) represents the total throughput the drive is able to sustain during the tests during each phase. Latency, at least for the purposes of PCMark 8, takes on a different outlook and for this, we will term it ‘Total Storage Latency’. Typically, latency has been addressed as the time it takes for a command to be executed, or rather, the time from when the last command completed to the time that the next command started. This is shown below as ‘Average Latency’.
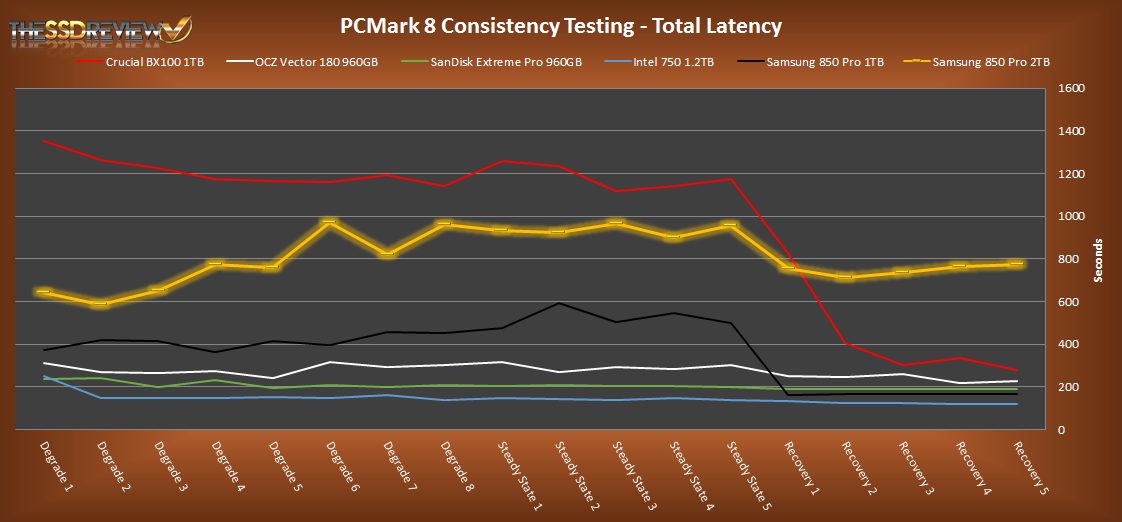
PCMark 8 provides a slightly different measurement, however, that we are terming as ‘Total Storage Latency’. This is represented as being the period from the time the last command was completed, until the time it took to complete the next task; the difference of course being that the execution of that task is included in ‘Total Storage Latency’. For both latency graphs, the same still exists where the lower the latency, the faster the responsiveness of the system will be. While both latency charts look very similar, the scale puts into perspective how just a few milliseconds can increase the length of time to complete multiple workloads.
For a more in-depth look into Latency, Bandwidth, and IOPS check out our primer article on them here.
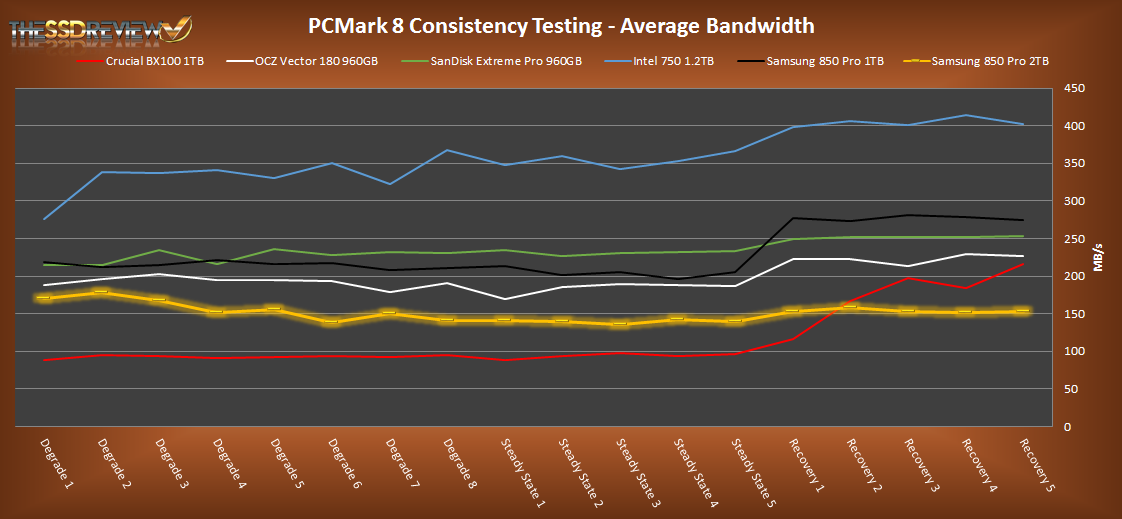
AVERAGE BANDWIDTH (OR THROUGHPUT)
These results show the total average bandwidth across all tests in the 18 phases. In this graph the higher the result the better.
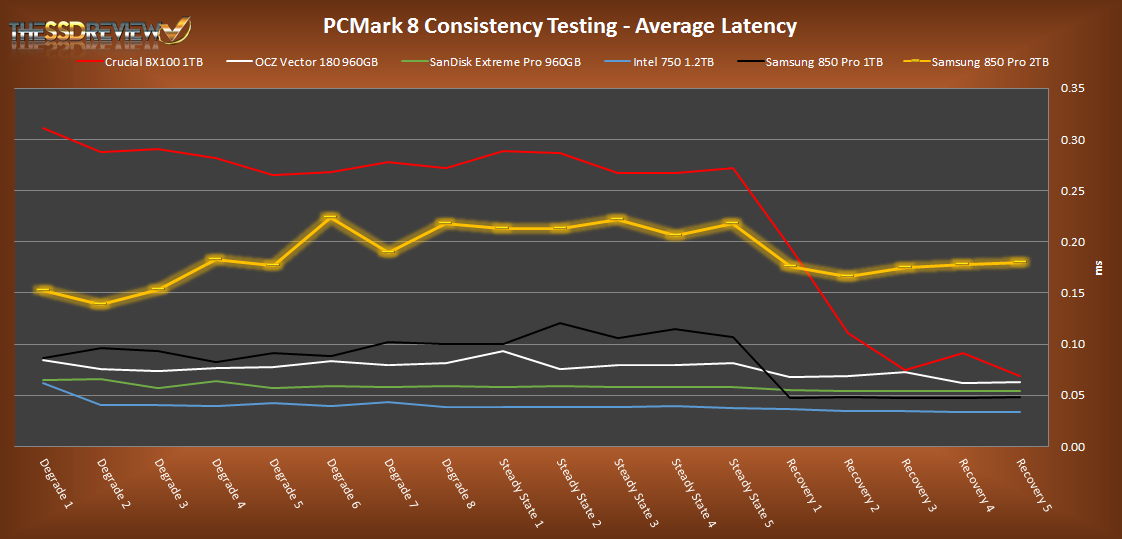
AVERAGE LATENCY (OR ACCESS TIME)
These results show the average access time during the workloads across all tests in the 18 phases. In this graph the lower the result the better.
TOTAL STORAGE LATENCY
These results show the total access time across all tests in the 18 phases. In this graph the lower the result the better.
ANALYSIS
We have included some different SSDs as a decent basis of comparison in this benchmark, however, you might note that none are 2TB SSDs. The closest comparable we could include was the 1TB version of thgis same drive and, as you can see, the results are much different. Where it is very typical to see normal SSDs (and the 1TB 850 pro specifically), increase significantly in performance at Recovery Stage 1 where TRIM and Garbage Collection are allowed to resume, the performance of the 2TB version of the 850 Pro remains consistent.
As well, we found the latency timing to be much hgher than where, at least we figured it should be. In this, we are wondering if this just might be a compatibility issue with the software that would never have been tested before release on 2TB SSDs, SSDs that take significantly longer to fill and in completing all tests.
To be frank, V-NAND was not needed for 2tb ssd.
Manufactureres can easily stuff 16 packages each having 128GB space using plain ol’ 2d nand.
Yes but…the problem then becomes one of performance versus the ability to provide the necessary power to the chips don’t you think? And how about DEVSlp?
If sandisk managed to make 4TB ssd with ordinary 2d flash, i’m sure sammy could aswell.
But in just happens that there was no demand, when 19nm was still a thing with samsung.
And i dont think 3d is all that more power efficient compared to 2d to be an excuse…
What about devsleep ? Care to elaborate ?
To compare apples to apples, the SanDisk 4TB was originally shipped as a 15mm ‘z’-height form factor, as opposed to 7mm ‘z’-height for the Sammies. I do believe that SanDisk now fits 4TB into a 9mm ‘z’-height form factor. Those “taller” ‘z’-heights won’t be fitting into too many laptops or other portable devices.
The 4 TB SSD was a dual PCB design and could never fit into a notyebook case. Further, it was noit a consumer SSD. I don’t think with the powering needs of an SSD with so many chips can DEVSLP be an option; I could be wrong.
Well, with 3D there are still the same amout of chips or dies compared to 2D.
Remember, 3D NAND has the same die size as 2D — 128Gbit.
So for 2TB, they need the same number of dies, be that 3d nand or 19nm 2D.
And fitting physically so much space was never a problem of chip density. We can do 256GB per package for quite some time now (840evo msata anyone ?).
If we put aside controller and heat limitations, we could put 4TB of flash on a standard 2.5″ formfactor , if there was demand for such drive.
Actually, according to a comment by Paul Alcorn from Tweaktown, the SanDisk 4 TB SSD has 3 PCBs: https://www.networkcomputing.com/storage/ssd-prices-in-a-freefall/a/d-id/1320958
nice review les, Might these drives push the 1/2 tb models finaly closer to the $200 price point? Im still running on my Mushkin Cronos Deluxe 120 … but I think its getting long in the tooth & while I think a move to a 256 gig SSD would probly be financialy better for me … I notice the 1/2 tb’s are getting around the $300 mark. Also my other issue is im again if you remember running a AM3+ FX cpu, so im not 100% committed to replacing the board with Zen just over a year away. Sugestions?/thought?
Thanks.
I don’t really think so. As much as we enjoy seeing the lower per GB point, these drives do not compete as they are still niche and in their own space IMO.
I do not understand how ordinary consumers feel content with new computers coming off the shelf as sluggish as it were 5 years old. In actuality I HAVE put them in 5 year old machines and it’s much much faster than those new budget machines.
Not to hijack the discussion – but any M.2 SATA 850 Pro or EVO with higher capacity, or are we stuck forever at 500GB? The technology appears to me similar, yet Samsung M.2 reached 500GB some time ago and stopped.
No newer FW-version than the one which bricked a lot of users’ 850 Pros (luckily my update went well) huh?
“Samsung has set a new bar in SSD pricing”
Are you kidding? The best bar that the Samsung 2 TB SSDs set is $0.40/GB. The competition’s 960 GB/1 TB SSDs regularly hit $350-$380, the Crucial M500 960 GB was $295-$305 until recently. This is the 840 Series all over again, where reviewers gave Samsung and their 840 Series TLC SSDs all the credit for the SSD price drops that the Crucial M500 series started.
so…. where can i buy 1 of these Beast_
Why are the PCB photos of EVO rotated the other way of the PRO? It makes it difficult to compare the chips of EVO and PRO, or was that the point?
Can I partition this SSD as a logical drive? I have a 500GB 850 EVO