
ATTO Disk Benchmark is perhaps one of the oldest benchmarks going and is definitely the main staple for manufacturer performance specifications. ATTO uses RAW or compressible data and, for our benchmarks, we use a set length of 256mb and test both the read and write performance of various transfer sizes ranging from 0.5 to 8192kb. Manufacturers prefer this method of testing as it deals with raw (compressible) data rather than random (includes incompressible data) which, although more realistic, results in lower performance results.
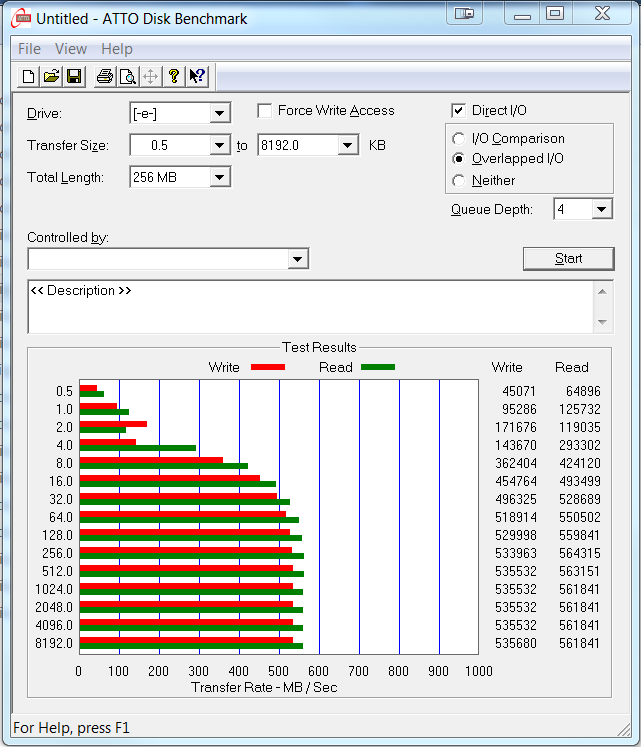
There are many that dislike ATTO as it measures in highly compressible data that manufacturers use to determine and publish their specifications; it is an unreal number for even the typical PC user. Looking past the read and write performance highs, we pay close attention to the performance progression as file size increases. The mark of a great SSD is a steady progression throughout, for both read and write. The mark of a top SATA 3 SSD today gets us SATA 3 speeds from the 4K file size. The Samsung 850 Pro does this and it is a great start.
CRYSTAL DISK BENCHMARK VER. 3.0 X64
Crystal Disk Benchmark is used to measure read and write performance through sampling of highly compressible data (oFill/1Fill), or random data which is, for the most part, incompressible. Performance is virtually identical, regardless of data sample so we have included only that using random data samples.
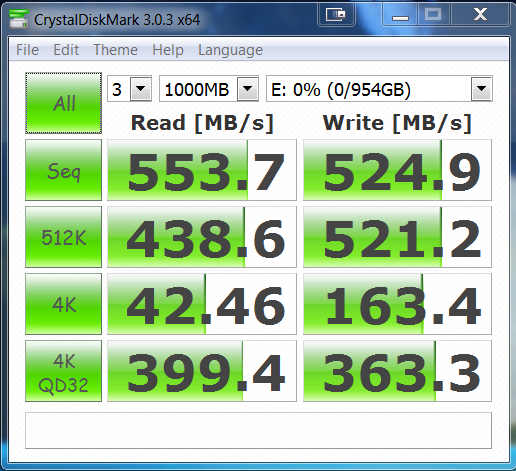
The performance of this Crystal DiskMark result is the highest we have ever had, bar none. Just the low 4K rtandom write performance of 163MB/s is something that we never thought we would see in a typical notebook consumer SSD.
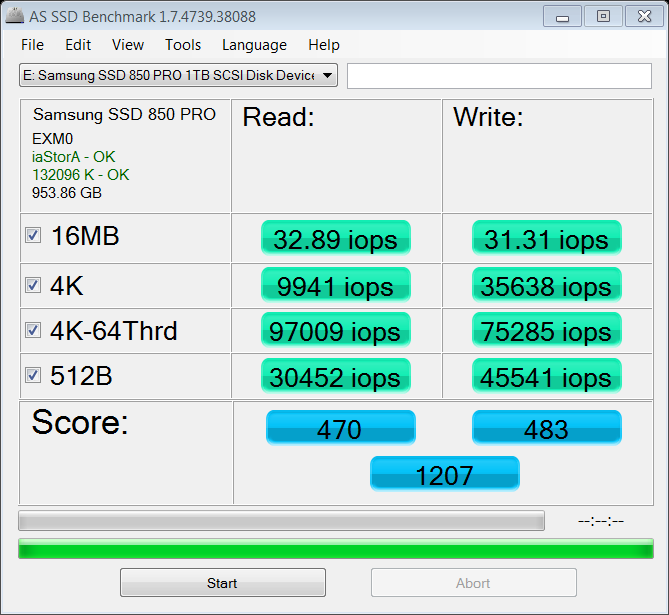
The toughest benchmark available for solid state drives is AS SSD as it relies solely on incompressible data samples when testing performance. For the most part, AS SSD tests can be considered the ‘worst case scenario’ in obtaining data transfer speeds and many enthusiasts like AS SSD for their needs. Transfer speeds are displayed on the left with IOPS results on the right.
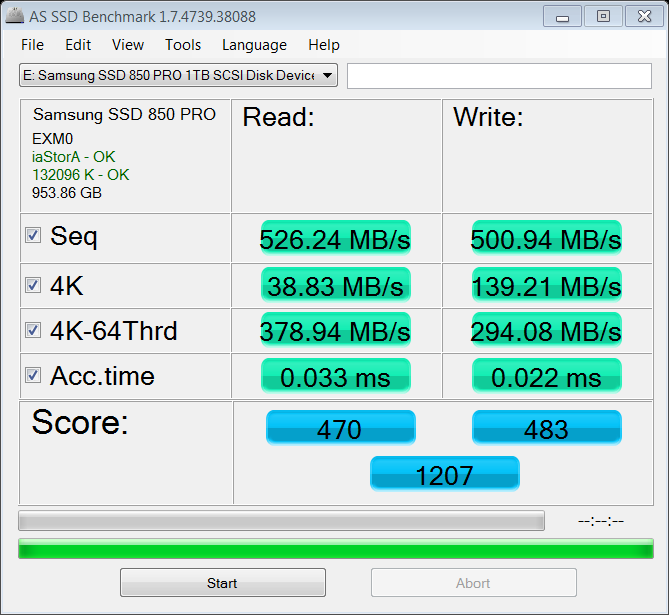
 Once again, these are the highest results we have ever attained in both throughput and IOPS for AS SSD when comparing similar drives. We actually retested a number of times trying to reach the 100K mark.
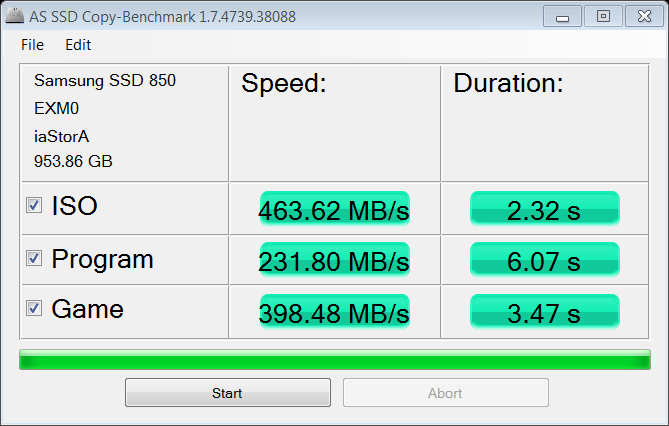
This AS SSD Copy Bench test is a true to life evaluation as AS SSD creates three files (ISO/Program/Game), and simply moves them from one part of the SSD to another, recording their top speed and total transfer time. Once again, these are great results, however, more attune to what we see from similar upper tier SSDs.
ANVIL STORAGE UTILITIES PROFESSIONAL
Anvil Storage Utilities (ASU) are the most complete test bed available for the solid state drive today. The benchmark displays test results for, not only throughput but also, IOPS and Disk Access Times. Not only does it have a preset SSD benchmark, but also, it has included such things as endurance testing and threaded I/O read, write and mixed tests, all of which are very simple to understand and use in our benchmark testing.
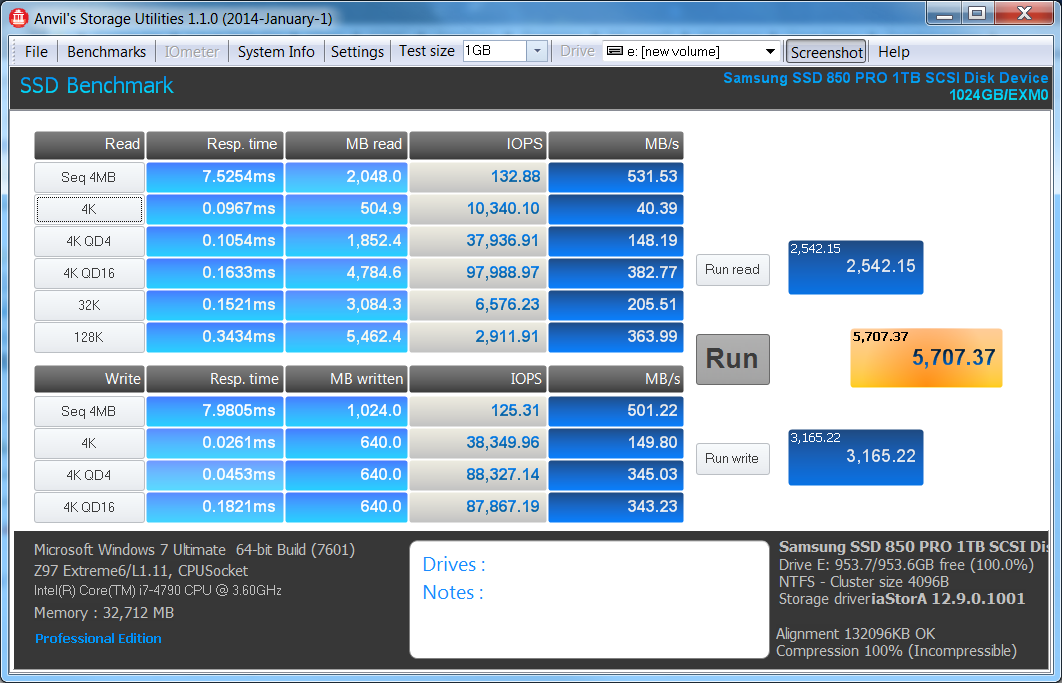
Once again, all results are amongst the best we have ever seen, right down to the disk access times (resp.time) Anvil is one of our favorite benchmarks as it provides a clear picture of all performance variables, including system and SSD descriptions.
waahhhh a price point would be nice as well
Pricing is listed in the article….thanks ahead!
Not worth the price premium IMO. I don’t care much about SSDs faster than the Crucial M550 or Samsung 830 Evo until the interface becomes faster (ie. SATA Express next year)
> Each chip has a RAW value of 128GB
That is wrong. you will find different types of flash chips on both sides of the ssd:
16 x 86 GBit = 172 GByte x 4 = 688 GByte
8 x 86 GBit = 86 GByte x 4 = 344 GByte
Sum: 1032 GByte
So basicly inside the packages there is no need for stacked dies, since there are already so many tranzistors packed on each other.. Is this correct or can 3D nand have multiple dies aswell ?
It looks like this drive is the new king – of SATA 3 drives. That and well, it seems to be bottlenecked by SATA 3. I imagine an XP941-like drive with V-NAND would be awesome.
I’m not sure what to make of it though.
– PCI-E, M.2, and likely SATA Express drives will probably be faster
– Among the PCI-E drives, well, the MX100 is offering literally double as much storage for the same price, assuming these MSRPs are to be believed
Other issues.
– Then there’s the risk of V-NAND issues if things don’t work out
– On the upside, if it does, well V-NAND because it’s using a bigger process than the others, ought to have pretty awesome endurance. We are looking at 40 nm V-NAND here.
Hmm … at 20 nm, the amount of storage available in a few years ought to be like 16Tb? Especially if they get more layers of V-NAND on the chips.
Hopefully samsung brings this to mainstream drives aswell. It would be awsome to see a MX100 killer 🙂
No supercaps on this model ???
No supercaps…
Hmmm, now I’m wondering if this V-NAND has power issues and can’t be driven by supercap level current if the need arises..
You gave a 5 star for performance of the Sandisk Extreme Pro.
https://www.thessdreview.com/our-reviews/sandisk-extreme-pro-ssd-review/
And Samsung 850 Pro is MUCH! FASTER and MUC MORE POWERFUL! than the Sandisk Extreme Pro.
https://1-ps.googleusercontent.com/h/www.thessdreview.com/wp-content/uploads/2014/06/616x612x850-pro-Vantage-Chart.png.pagespeed.ic.jg-AKOvhBV.jpg
But you give only 4.5 star for the performance of Samsung 850 Pro.
I do not trust the Honesty of your reviews any more.
After updating to Magician 4.4 last night and enabling RAPID, my 840 EVO reads at nearly 8GB/s. Again, not sure if it’s real-world noticeable, but maps seem to load PFQ.
My 1TB EVO 840 was only $400, I don’t see paying the $320 or so difference for this drive. It’s not worth the extra money.
Where did you get the figures of 3W for active and .4W idle power consumption?
Official site is mum on the specifications so far.
https://www.samsung.com/global/business/semiconductor/minisite/SSD/global/html/ssd850pro/overview.html
That would have come from documentation in our possession and received from Samsung.
What would be of great interest to many is the result of enterprise benchmarks (those used for 845DC Pro) run on 850 Pro that was formatted (overprovisioned) to match 845DC Pro capacity – i.e. to 400GB or 800GB.
If benchmark results are comparable, it seems possible to save tons of money by using 850 Pro in a more read-oriented server environments (lack of supercaps can be dealt with at the system – not SSD – level).
Any chance you can run those tests?
A 850 Pro 512 GB (with Rapid mode) or a M2 XP941 512 GB would be the most performant option for a new X99 build?
Absolutely the better of the two is the XP941 as it gives you that performance all the time and full throttle. RAPID is a caching program and acts only as such in certain scenarios.
Why is “The performance of this Crystal DiskMark result is the highest we have ever had, bar none”? Most of the results are lower than the 840 Pro, by almost half in the sequential results:
https://www.thessdreview.com/wp-content/uploads/2013/12/840-Pro-RAPID-Bench-Crystal-DiskMark.png
850’s results:
https://www.thessdreview.com/wp-content/uploads/2014/06/Samsung-850-Pro-CDM.png
It would be nice if the results were all clear-cut (e.g. drive A is superior to drive B in every rating in every test) instead of the rock-paper-scissors game, but that’s the way it was for my 840 Pro pick to begin with.
Ummm… are you aware that you are comparing a single SSDs results to that of an SSD in RAPID mode which uses DRAM to increase performance? Totally different concept…
That would explain the difference. The original 840 Pro review displays scores that are still higher than the 850 Pro’s by some measurements, but no where near the RAPID scores. The 850 Pro has some of the RAPID scores posted near the end of the interview, but does not display the results of every test following enabling RAPID.
https://www.thessdreview.com/wp-content/uploads/2012/09/OptCDMRandom.png