
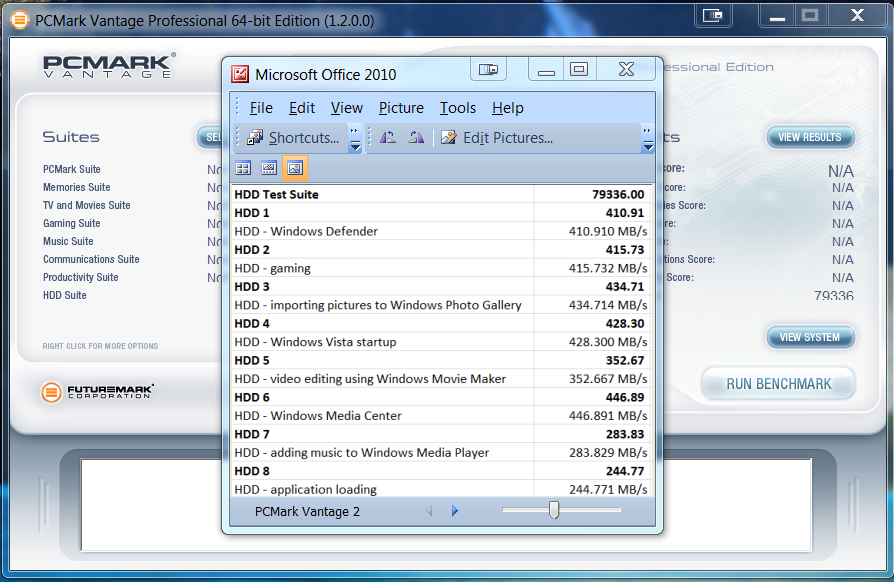
The SSD Review uses benchmark software called PCMark Vantage x64 HDD Suite to create testing scenarios that might be used in the typical user experience. There are eight tests in all and the tests performed record the speed of data movement in MB/s to which they are then given a numerical score after all of the tests are complete. The simulations are as follows:
- Windows Defender In Use
- Streaming Data from storage in games such as Alan Wake which allows for massive worlds and riveting non-stop action
- Importing digital photos into Windows Photo Gallery
- Starting the Vista Operating System
- Home Video editing with Movie Maker which can be very time consuming
- Media Center which can handle video recording, time shifting and streaming from Windows media center to an extender such as XBox
- Cataloging a music library
- Starting applications
SAMSUNG 850 PRO SSD PCMARK VANTAGE RESULTS
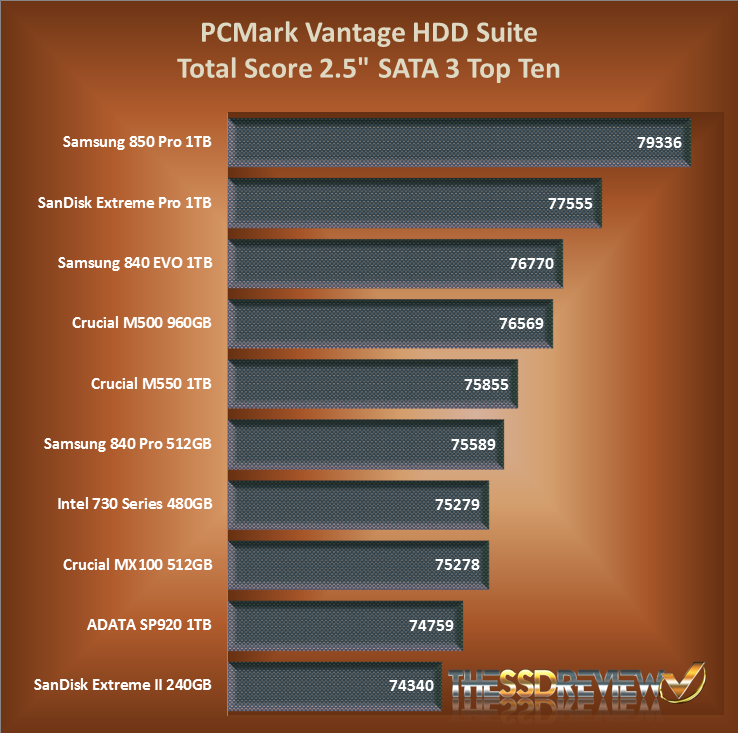
The Samsung 850 Pro returned a Total Point Score of 79336 with a high transfer speed of 446MB/s while testing in Windows Media center. More interesting though, is the fact that all but the last test result were in the SATA 3 result area. Our next closest SSD to this score was the SanDisk Pro SSD at 77555 points only a few weeks back.
Taking into consideration this Samsung result, we have a new ‘Top Dog’ on our SSD Hierarchy Chart, remembering of course that the only criteria that gets calculated here is the PCMark Vantage Total Score. Over time, we have come to confirm that this chart is ‘relatively’ accurate to SSD placement in the industry.
PCMARK 8 EXTENDED STORAGE WORKLOAD
CONSISTENCY TESTING
For our last benchmark, we are using PCMark 8 Extended Storage Workload in order to determine steady state throughput of the Samsung 850 Pro 128GB SSD, as compared to the SanDisk Extreme Pro 240GB SSD.. This software is the longest in our battery of tests and takes just under 18 hours per SSD. As this is a specialized component of PCMark 8 Professional, its final result is void of any colorful graphs or charts typical of the normal online results and deciphering the resulting excel file into an easily understood result takes several more hours.
There are 18 phases of testing throughout the entire run, 8 runs of the Degradation Phase, 5 runs of the Steady State Phase and 5 runs of the Recovery Phase. In each phase, several performance tests are run of 10 different software programs; Adobe After Effects, Illustrator, InDesign, Photoshop Heavy and Photoshop Light, Microsoft Excel, Powerproint and Word, as well as Battlefield 3 and World of Warcraft to cover the gaming element.
- PRECONDITIONING -The entire SSD is filled twice sequentially with random data of a 128KB file size. The second run accounts for overprovisioning that would have escaped the first;
- DEGRADATION PHASE – The SSD is hit with random writes of between 4KB and 1MB for 10 minutes and then a single pass performance test is done of each application. The cycle is repeated 8 times, and with each time, the duration of random writes increases by 5 minutes;
- STEADY STATE PHASE – The drive is hit with random writes of between 4KB and 1MB for 45 minutes before each application is put through a performance test. This process is repeated 5 times;
- RECOVERY PHASE – The SSD is allowed to idle for 5 minutes before and between performance tests of all applications. This is repeated 5 times which accounts for garbage collection; and
- CLEANUP – The entire SSD is written with zero data at a write size of 128KB
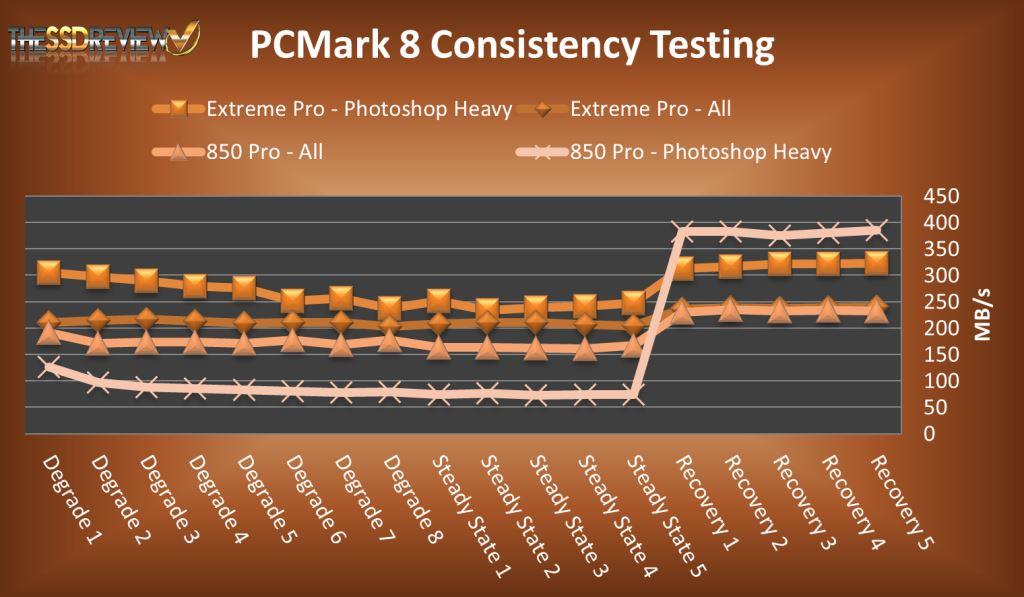
In examining this chart initially, it appears that the SanDisk Extreme Pro is the clear winner, but this is a bit of a deception. In looking closely at the two drives, we need to take note that, not only is the SanDisk a larger capacity, but also, the SanDisk is a 240GB SSD, vice 256GB SSD, which alerts us that the SanDisk SSD has 7% over-provisioning, whereas the Samsung 850 Pro does not. This is very important as a main feature of over-provisioning is performance consistency as the drive fills; something that may not be evident in the Samsung 850 Pro as we see it here. We wanted to get this result posted as it represents the state of both SSDs as the consumer would have in hand, however, over-provisioning can be increased in Samsung SSDs with the Samsung SSD Magician. An unfortunate difficulty with PCMark 8 is the fact that these specific tests require an unpartitioned drive and, in the case of the Samsung SSD, this would be lost as it is a higher level ‘partition’ OP.
Even with this in mind, there is still a huge take away here for the Samsung 850 Pro. We have scoured the net for all PCMark 8 related testing and it appears that the 850 Pro is the clear performance winner in the recovery phases ( at least in Photoshop Heavy tests), or when the drive is allowed to do its garbage collection and TRIM is working properly. This particular scenario applies best to typical and enthusiast consumer scenarios, as well as that of media professionals. Stay tuned in the near future as we aim to provide the complete PCMark 8 test result picture, inclusive of all test applications and our cache of SSDs. For the complete picture of the Samsung 850 Pro 128GB SSD, check our detailed analysis at Technology X.
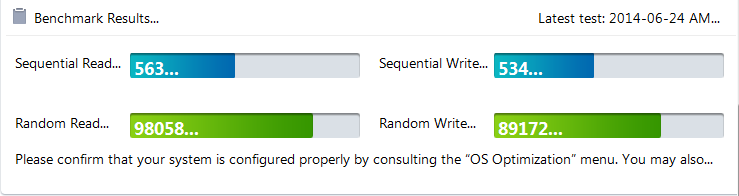
As a bit of an extra, we decided to test the new 850 Pro with Samsung’s own SSD Magician:
waahhhh a price point would be nice as well
Pricing is listed in the article….thanks ahead!
Not worth the price premium IMO. I don’t care much about SSDs faster than the Crucial M550 or Samsung 830 Evo until the interface becomes faster (ie. SATA Express next year)
> Each chip has a RAW value of 128GB
That is wrong. you will find different types of flash chips on both sides of the ssd:
16 x 86 GBit = 172 GByte x 4 = 688 GByte
8 x 86 GBit = 86 GByte x 4 = 344 GByte
Sum: 1032 GByte
So basicly inside the packages there is no need for stacked dies, since there are already so many tranzistors packed on each other.. Is this correct or can 3D nand have multiple dies aswell ?
It looks like this drive is the new king – of SATA 3 drives. That and well, it seems to be bottlenecked by SATA 3. I imagine an XP941-like drive with V-NAND would be awesome.
I’m not sure what to make of it though.
– PCI-E, M.2, and likely SATA Express drives will probably be faster
– Among the PCI-E drives, well, the MX100 is offering literally double as much storage for the same price, assuming these MSRPs are to be believed
Other issues.
– Then there’s the risk of V-NAND issues if things don’t work out
– On the upside, if it does, well V-NAND because it’s using a bigger process than the others, ought to have pretty awesome endurance. We are looking at 40 nm V-NAND here.
Hmm … at 20 nm, the amount of storage available in a few years ought to be like 16Tb? Especially if they get more layers of V-NAND on the chips.
Hopefully samsung brings this to mainstream drives aswell. It would be awsome to see a MX100 killer 🙂
No supercaps on this model ???
No supercaps…
Hmmm, now I’m wondering if this V-NAND has power issues and can’t be driven by supercap level current if the need arises..
You gave a 5 star for performance of the Sandisk Extreme Pro.
https://www.thessdreview.com/our-reviews/sandisk-extreme-pro-ssd-review/
And Samsung 850 Pro is MUCH! FASTER and MUC MORE POWERFUL! than the Sandisk Extreme Pro.
https://1-ps.googleusercontent.com/h/www.thessdreview.com/wp-content/uploads/2014/06/616x612x850-pro-Vantage-Chart.png.pagespeed.ic.jg-AKOvhBV.jpg
But you give only 4.5 star for the performance of Samsung 850 Pro.
I do not trust the Honesty of your reviews any more.
After updating to Magician 4.4 last night and enabling RAPID, my 840 EVO reads at nearly 8GB/s. Again, not sure if it’s real-world noticeable, but maps seem to load PFQ.
My 1TB EVO 840 was only $400, I don’t see paying the $320 or so difference for this drive. It’s not worth the extra money.
Where did you get the figures of 3W for active and .4W idle power consumption?
Official site is mum on the specifications so far.
https://www.samsung.com/global/business/semiconductor/minisite/SSD/global/html/ssd850pro/overview.html
That would have come from documentation in our possession and received from Samsung.
What would be of great interest to many is the result of enterprise benchmarks (those used for 845DC Pro) run on 850 Pro that was formatted (overprovisioned) to match 845DC Pro capacity – i.e. to 400GB or 800GB.
If benchmark results are comparable, it seems possible to save tons of money by using 850 Pro in a more read-oriented server environments (lack of supercaps can be dealt with at the system – not SSD – level).
Any chance you can run those tests?
A 850 Pro 512 GB (with Rapid mode) or a M2 XP941 512 GB would be the most performant option for a new X99 build?
Absolutely the better of the two is the XP941 as it gives you that performance all the time and full throttle. RAPID is a caching program and acts only as such in certain scenarios.
Why is “The performance of this Crystal DiskMark result is the highest we have ever had, bar none”? Most of the results are lower than the 840 Pro, by almost half in the sequential results:
https://www.thessdreview.com/wp-content/uploads/2013/12/840-Pro-RAPID-Bench-Crystal-DiskMark.png
850’s results:
https://www.thessdreview.com/wp-content/uploads/2014/06/Samsung-850-Pro-CDM.png
It would be nice if the results were all clear-cut (e.g. drive A is superior to drive B in every rating in every test) instead of the rock-paper-scissors game, but that’s the way it was for my 840 Pro pick to begin with.
Ummm… are you aware that you are comparing a single SSDs results to that of an SSD in RAPID mode which uses DRAM to increase performance? Totally different concept…
That would explain the difference. The original 840 Pro review displays scores that are still higher than the 850 Pro’s by some measurements, but no where near the RAPID scores. The 850 Pro has some of the RAPID scores posted near the end of the interview, but does not display the results of every test following enabling RAPID.
https://www.thessdreview.com/wp-content/uploads/2012/09/OptCDMRandom.png