

TSSDR TEST BENCH AND PROTOCOL
SSD testing at TSSDR differs slightly, depending on whether we are looking at consumer or enterprise storage media. For our MyDigitalSSD BPX Pro 2TB NVMe M.2 SSD testing today, our goal is to test in a system that has been optimized with our SSD Optimization Guide. To see the best performance possible, the CPU C states have been disabled, C1E support has been disabled, and Enhanced Intel SpeedStep Technology (EIST) has been disabled. Benchmarks for client testing are also benchmarks with a fresh drive so, not only can we verify that manufacturer specifications are in line but also, so those buying pre-built systems with the MyDigitalSSD BPX Pro can replicate our tests to confirm that they have an SSD that is top-notch. We even provide links to most of the benchmarks used in the report.
SYSTEM COMPONENTS
The components of this Test Bench are detailed below. All hardware is linked for purchase and product sales may be reached by a simple click on the individual item. As well, the title is linked back to the individual build article where performance testing can be validated.
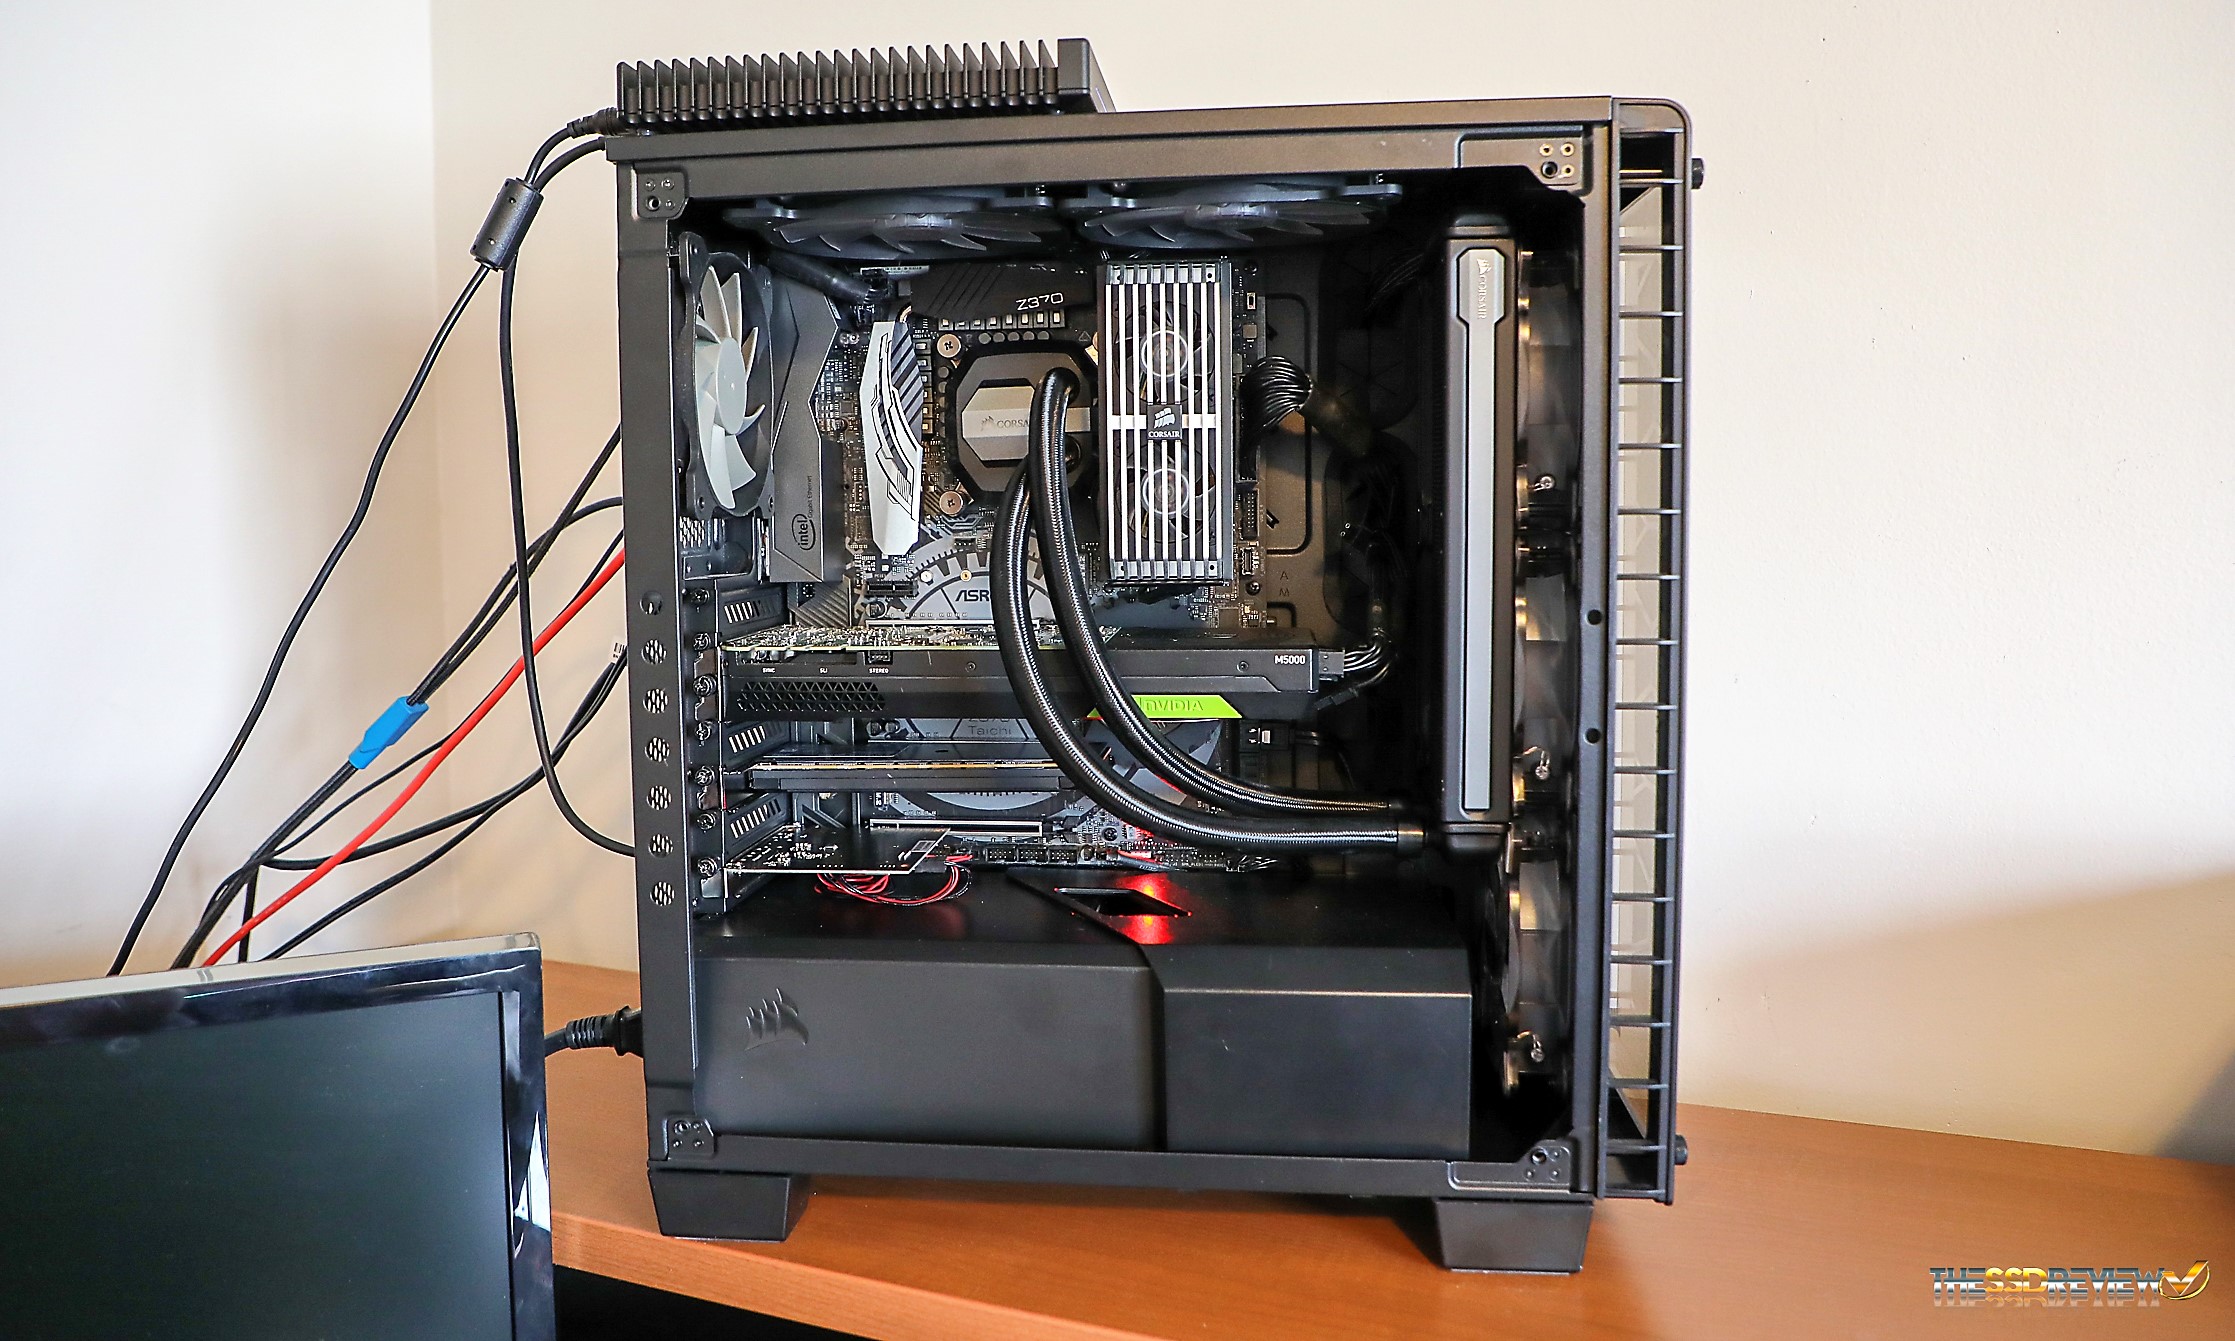
TSSDR ASROCK Z370 TAICHI TEST BENCH (link)
| PC CHASSIS: | Corsair Crystal Series 460X RGB |
| MOTHERBOARD: | ASRock Z370 Taichi |
| CPU: | Intel Coffee Lake Core i7-8770K |
| CPU COOLER: | Corsair Hydro Series H110i GTX |
| POWER SUPPLY: | Corsair RM850x 80Plus |
| GRAPHICS: | PNY GTX 1080 XLR8 Gaming OC |
| MEMORY: | Corsair Dominator Pl 32GB 2800 |
| STORAGE: | Intel Optane 900P 480GB SSD |
| KEYBOARD: | Corsair Strafe RGB Silent Gaming |
| MOUSE: | Corsair M65 Pro Gaming |
| OS | Microsoft Windows 10 Pro 64 Bit |
BENCHMARK SOFTWARE
The software in use for today’s analysis is typical of many of our reviews and consists of Crystal Disk Info, ATTO Disk Benchmark, Crystal Disk Mark, AS SSD, Anvil’s Storage Utilities, AJA, PCMark Vantage, TxBench, as well as true data testing. Our selection of software allows each to build on the last and to provide validation to results already obtained.
ATTO Disk Benchmark is perhaps one of the oldest benchmarks going and is definitely the main staple for manufacturer performance specifications. ATTO uses RAW or compressible data and, for our benchmarks, we use a set length of 256mb and test both the read and write performance of various transfer sizes ranging from 0.5 to 8192kb. Manufacturers prefer this method of testing as it deals with raw (compressible) data rather than random (includes incompressible data) which, although more realistic, results in lower performance results.
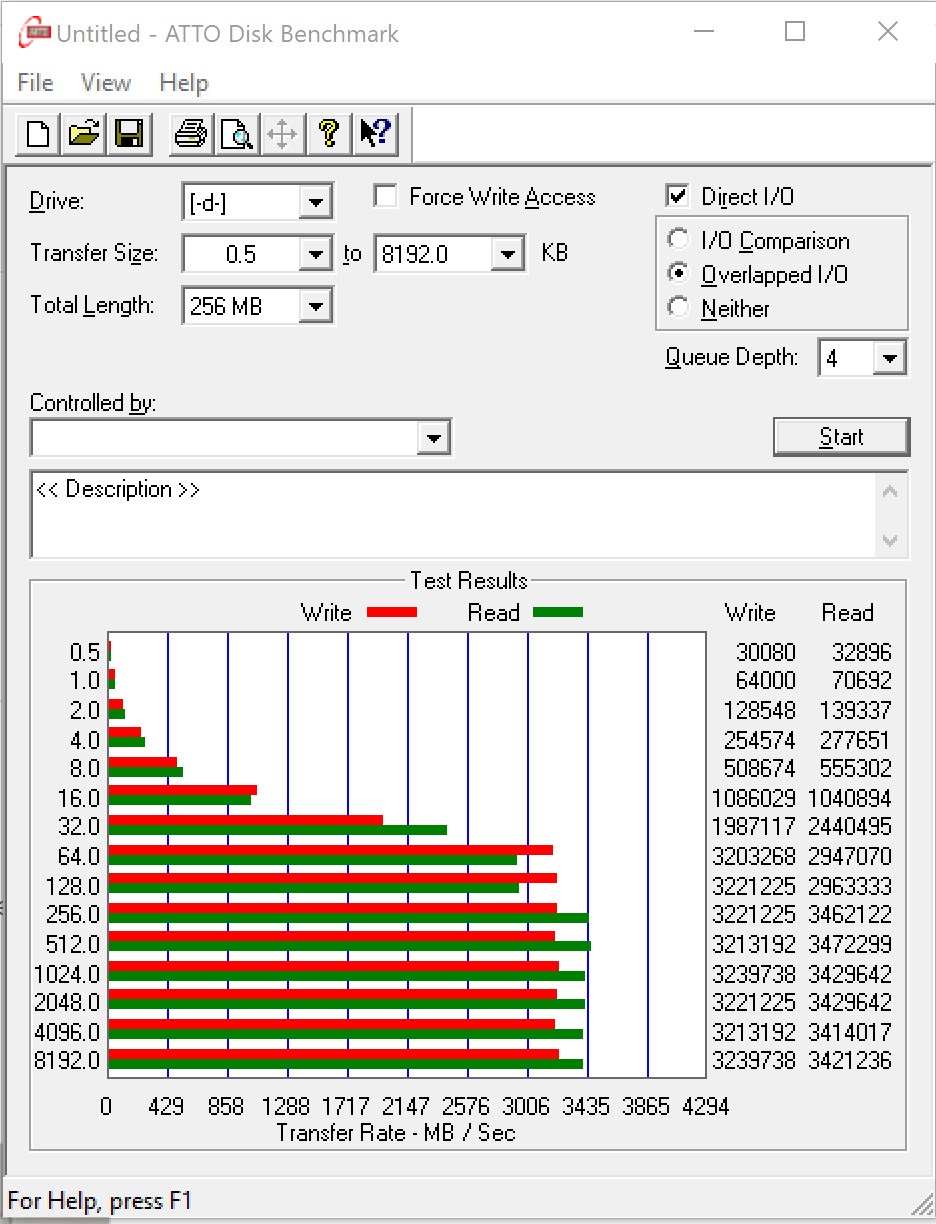
Our ATTO results are very strong and display a steady performance increase as sample sizes increase. In addition, the performance results of 3.4GB/s read and 3.2GB/s write confirm listed MyDigitalSSD specifications.
CRYSTAL DISK BENCHMARK VER. 5.5.0 X64
Crystal Disk Benchmark is used to measure read and write performance through sampling of random data which is, for the most part, incompressible. Performance is virtually identical, regardless of data sample so we have included only that using random data samples.
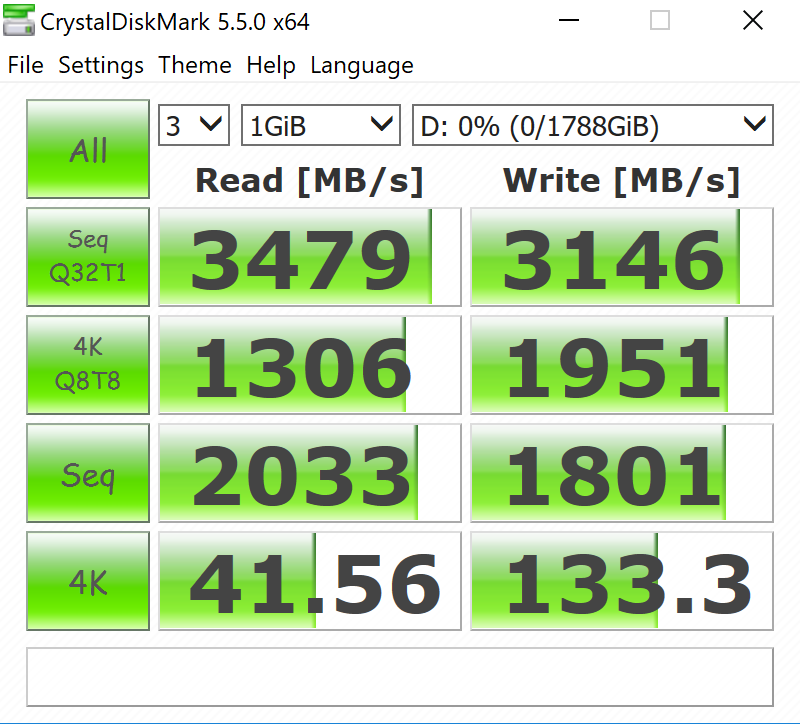
Once again, we see very strong performance of 3.4GB/s read and 3.1GB/s write, however, it would have been nice to see low 4k random results just a bit higher.
“This SSD is listed as a 1920GB SSD, vice what adds up to be 2048GB as might normally be calculated by RAW NAND flash memory; this accounts for over-provisioning. When we format the SSD, however, the total available storage space available to the user is only 1788GB. ”
Sigh. It’s just GB versus GiB. You guys should know better.