
For our last benchmark, we have decided to use PCMark 8 Extended Storage Workload in order to determine steady state throughput of the SSD. This software is the longest in our battery of tests and takes just under 18 hours per SSD. As this is a specialized component of PCMark 8 Professional, its final result is void of any colorful graphs or charts typical of the normal online results and deciphering the resulting excel file into an easily understood result takes several more hours.
There are 18 phases of testing throughout the entire run, 8 runs of the Degradation Phase, 5 runs of the Steady State Phase and 5 runs of the Recovery Phase. In each phase, several performance tests are run of 10 different software programs; Adobe After Effects, Illustrator, InDesign, Photoshop Heavy and Photoshop Light, Microsoft Excel, PowerPoint and Word, as well as Battlefield 3 and World of Warcraft to cover the gaming element.
- PRECONDITIONING -The entire SSD is filled twice sequentially with random data of a 128KB file size. The second run accounts for overprovisioning that would have escaped the first;
- DEGRADATION PHASE – The SSD is hit with random writes of between 4KB and 1MB for 10 minutes and then a single pass performance test is done of each application. The cycle is repeated 8 times, and with each time, the duration of random writes increases by 5 minutes;
- STEADY STATE PHASE – The drive is hit with random writes of between 4KB and 1MB for 45 minutes before each application is put through a performance test. This process is repeated 5 times;
- RECOVERY PHASE – The SSD is allowed to idle for 5 minutes before and between performance tests of all applications. This is repeated 5 times which accounts for garbage collection; and
- CLEANUP – The entire SSD is written with zero data at a write size of 128KB
In reading the results, the Degrade and Steady State phases represent heavy workload testing while the recovery phase represents typical consumer light workload testing.
As you can see, performance is recorded in terms of Bandwidth and Latency. Bandwidth (or throughput) represents the total throughput the drive is able to sustain during the tests during each phase. Latency, at least for the purposes of PCMark 8, takes on a different outlook and for this, we will term it ‘Total Storage Latency’. Typically, latency has been addressed as the time it takes for a command to be executed, or rather, the time from when the last command completed to the time that the next command started. This is shown below as ‘Average Latency’.
PCMark 8 provides a slightly different measurement, however, that we are terming as ‘Total Storage Latency’. This is represented as being the period from the time the last command was completed, until the time it took to complete the next task; the difference of course being that the execution of that task is included in ‘Total Storage Latency’. For both latency graphs, the same still exists where the lower the latency, the faster the responsiveness of the system will be. While both latency charts look very similar, the scale puts into perspective how just a few milliseconds can increase the length of time to complete multiple workloads.
For a more in-depth look into Latency, Bandwidth, and IOPS check out our primer article on them here.
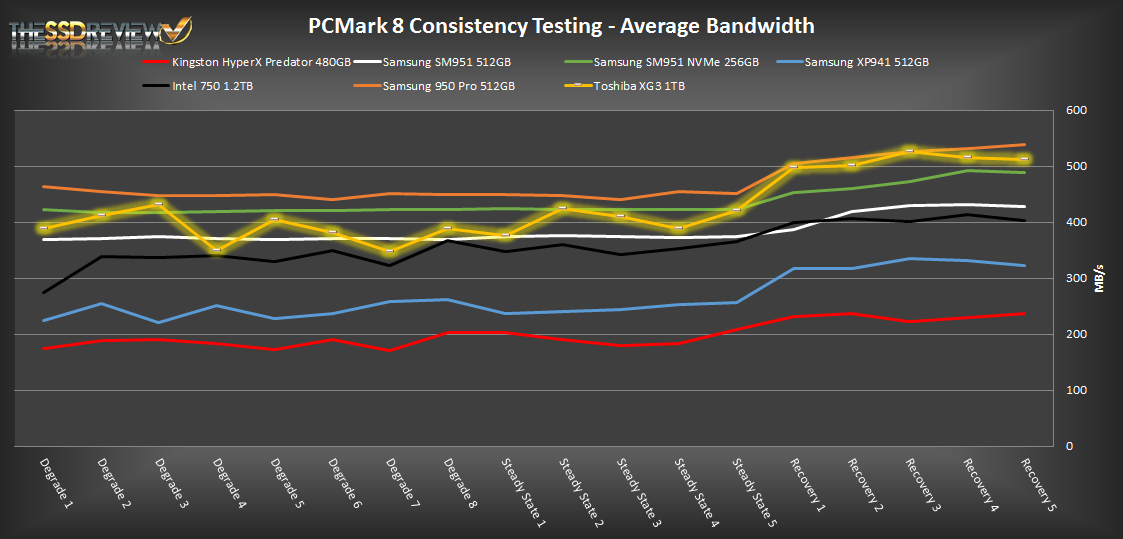
AVERAGE BANDWIDTH (OR THROUGHPUT)
These results show the total average bandwidth across all tests in the 18 phases. In this graph the higher the result the better.
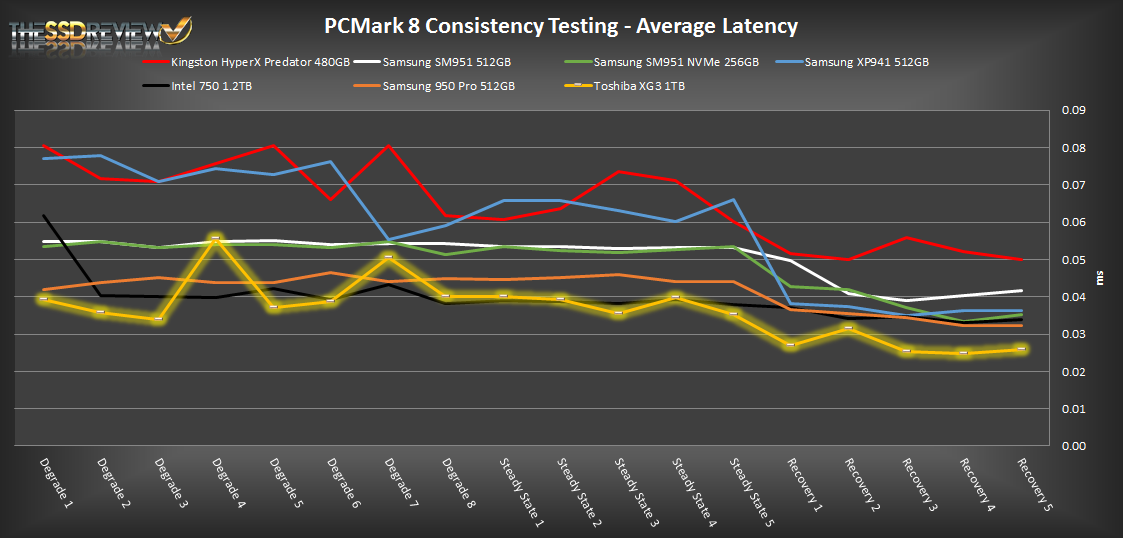
AVERAGE LATENCY (OR ACCESS TIME)
These results show the average access time during the workloads across all tests in the 18 phases. In this graph the lower the result the better.
TOTAL STORAGE LATENCY
These results show the total access time across all tests in the 18 phases. In this graph the lower the result the better.
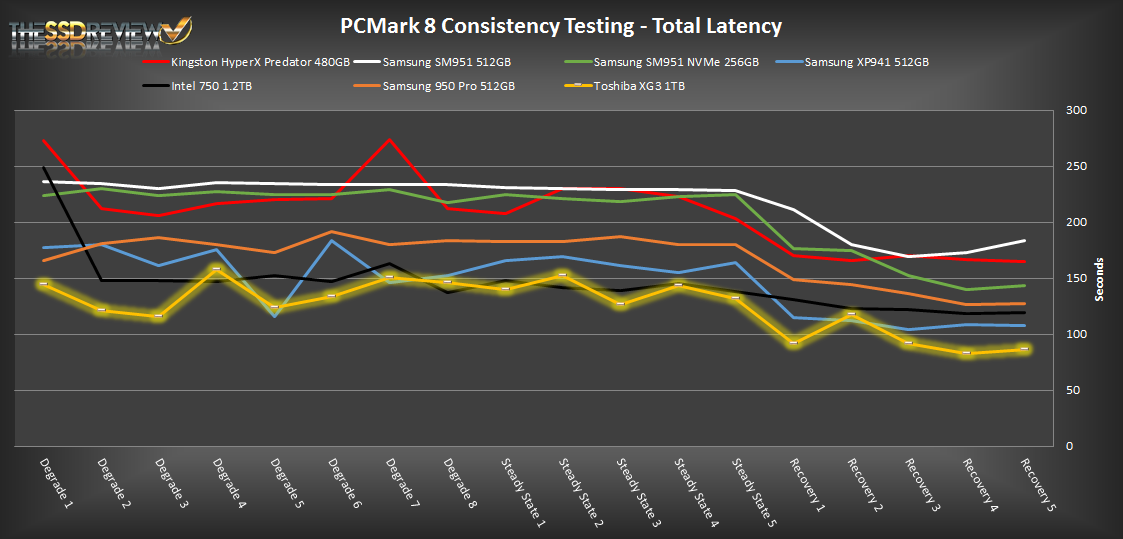
Although the Samsung 950 Pro M.2 SSD pulled through with the highest bandwidth, the Toshiba XG3 M.2 1TB SSD gained top marks in both in Average and Total Latency results. Low latency is exactly the target Toshiba was trying to hit with the XG3.
Thats some pretty good stuff from toshiba. And from 2D MLC flash.
I do wonder however what controller is that. Obviously its not made by toshiba. Something from OCZ maybe ? Or phison E7?
There is a bit of investigation about the net that eludes to this being the Phison E-7, however, not enough to confirm or mention such within the article.
No, the controller is solely Toshiba’s.
Link? Maybe a bit of validation or reasoning behind your thought?
This is the Fujisan controller that was on display with OCZ as part of their Revo 400 release at Computex last year. We have elaborated on this within the report in controller description and the final para. This link shows what we posted prior.
https://www.thessdreview.com/daily-news/latest-buzz/ocz-prepares-new-revodrive-400-m-2-nvme-ssd-for-retail-release-computex-2015-update/
Thats some pretty good stuff from toshiba.
Bring on the 1Tb M.2 NVME Drives!!! (its the only thing stopping me from dropping a lot of moneys (and selling 1/2 a liver) and getting a new Rig.
Your claim for Crystal Disk Benchmark is several times higher than mine, on my 2013 Dell XPS-15 notebook computer. The original factory mSATA SSD was replaced a few months ago with a terabyte Samsung 850 EVO.
How comparable are the results of your tests, compared to those of your readers? If I install one of your tested products, how much performance difference should we expect? Several times?
My next upgrade might be to replace to original terabyte spinning HDD with a SSD of one or two terabytes. Perhaps.
The Samsung 850 EVO SSD (mSata) uses the mSata Standard and can not go as fast as the drives in this review.
The Drives in this review are M.2 (PCIE NVME) SSD’s and have access to 4 PCIE lanes which is Considerably much faster than Sata be it on: mSata on mini-pci(e) or M.2
https://en.wikipedia.org/wiki/M.2
You should’ve bought an M.2 or PCIE SSD if you wanted pure speed and didn’t care about the cost.
All I will say is you can’t really get away with comparing mSATA or SATA against PCIe storage. Its kinda like comparing PCIe video cards to AGP video cards, or even PCI to PCIe, it just isn’t a fair comparison. The PCIe bus is magnitudes better at moving data than the SATA bus will ever be. Now if you want to put FOUR 850 EVOs into RAID0, then we can talk comparisons because that MIGHT (I stress might, lol) compete with the single PCIe SSD given the usage scenario.
The advice to disable cache flush is wrong. You should only mark this option is the SSD has capacitors to protect unflushed data on power loss. So the drive runs faster but Your data is not safe, this is trade off. pease be aware of that. if the performance without this option is low then the controller or firmware is not well designed or… other controllers do not respect host request to flush cache. Do You have any information what is the real issue? Regards
This is not uncommon. It is also much the same regardless of system and, yes is a tradeoff.
The SSD folks who improve performance by playing games with memory inherently increase the risk of data loss if the devices lack supercaps and ECC RAM. The topic of ECC RAM has never come up here but when the enterprise SSD/NVMe sizes climb into the Ts its a more valid concern. I’m not even sure if controllers can even catch internal bit errors in the RAM cache. I’ve never heard of ECC being available in single DRAMs.
Does this fit into a hp omen?
Guys. Thanks for an awesome review. Does anyone know where I can get the PCIe to USB 3.0 or to SATA adapter so I can get my data off this drive? I have a Dell XPS 15″ laptop that I paid $3,400 for and it won’t even turn on. Dell told me to take it to a local computer support specialist. Any help would be appreciated. EVERY SSD to USB adapter I found does not work with the M.2 Type 2280 NVMe pcie solid state interface. =-(
these first 2 are the usb version and description that you are looking for. i am unsure of your location, the prices are in u.s. dollars.
$125.75
https://www.microsatacables.com/m-2-ngff-pcie-ssd-to-usb-3-0-adapter-with-case
this ebay link is to a seller in china. $99.99
https://www.ebay.com/itm/M-2-NGFF-PCIe-KEY-M-Single-Notch-SSD-to-USB-3-0-External-Case-For-Samsung-XP941-/321905266017?hash=item4af30c8d61:g:NywAAOSwdndUlPsF
if you have a desktop or if you could use someones desktop these 2 links are for desktop adapters. they are also much cheaper.
$32.75 https://www.microsatacables.com/m2-ngff-pcie-ssd-m-key-to-pcie-x4-adapter-for-samsung-xp941-m2-xp941-p4x-adp
$34.99 https://www.startech.com/HDD/Adapters/pci-express-m2-pcie-ssd-adapter~PEX4M2E1
Thank you for all of that information. Not sure but it looks like the much coveted USB adapter does not support the M.2 MVNe version, at least in the description it only claims support for M.2 NGFF type pcie cards. I am going to call them, likely they are working on one to be released soon. I think NVMe is the newest M.2 pcie technology, so it makes sense that it is very difficult to find. The other PCIe cards for internal use do support the NVMe pcie interface. Your help is much appreciated. I found 2 new sites that I had not looked at before and for this I am grateful! Cheers.
Hello have this drive ona Lenovo x1 (Gen 3) and have no way to get it accepted. 2103 Detection Error , and than in the installation process which starts Hardware is not supported… Any help for that issue (love that drive for what it is, just want it installed ) Thanks