

The SSD Review uses benchmark software called PCMark Vantage x64 HDD Suite to create testing scenarios that might be used in the typical user experience. There are eight tests in all and the tests performed record the speed of data movement in MB/s to which they are then given a numerical score after all of the tests are complete. The simulations are as follows:
- Windows Defender In Use
- Streaming Data from storage in games such as Alan Wake which allows for massive worlds and riveting non-stop action
- Importing digital photos into Windows Photo Gallery
- Starting the Vista Operating System
- Home Video editing with Movie Maker which can be very time consuming
- Media Center which can handle video recording, time shifting and streaming from Windows media center to an extender such as XBox
- Cataloging a music library
- Starting applications
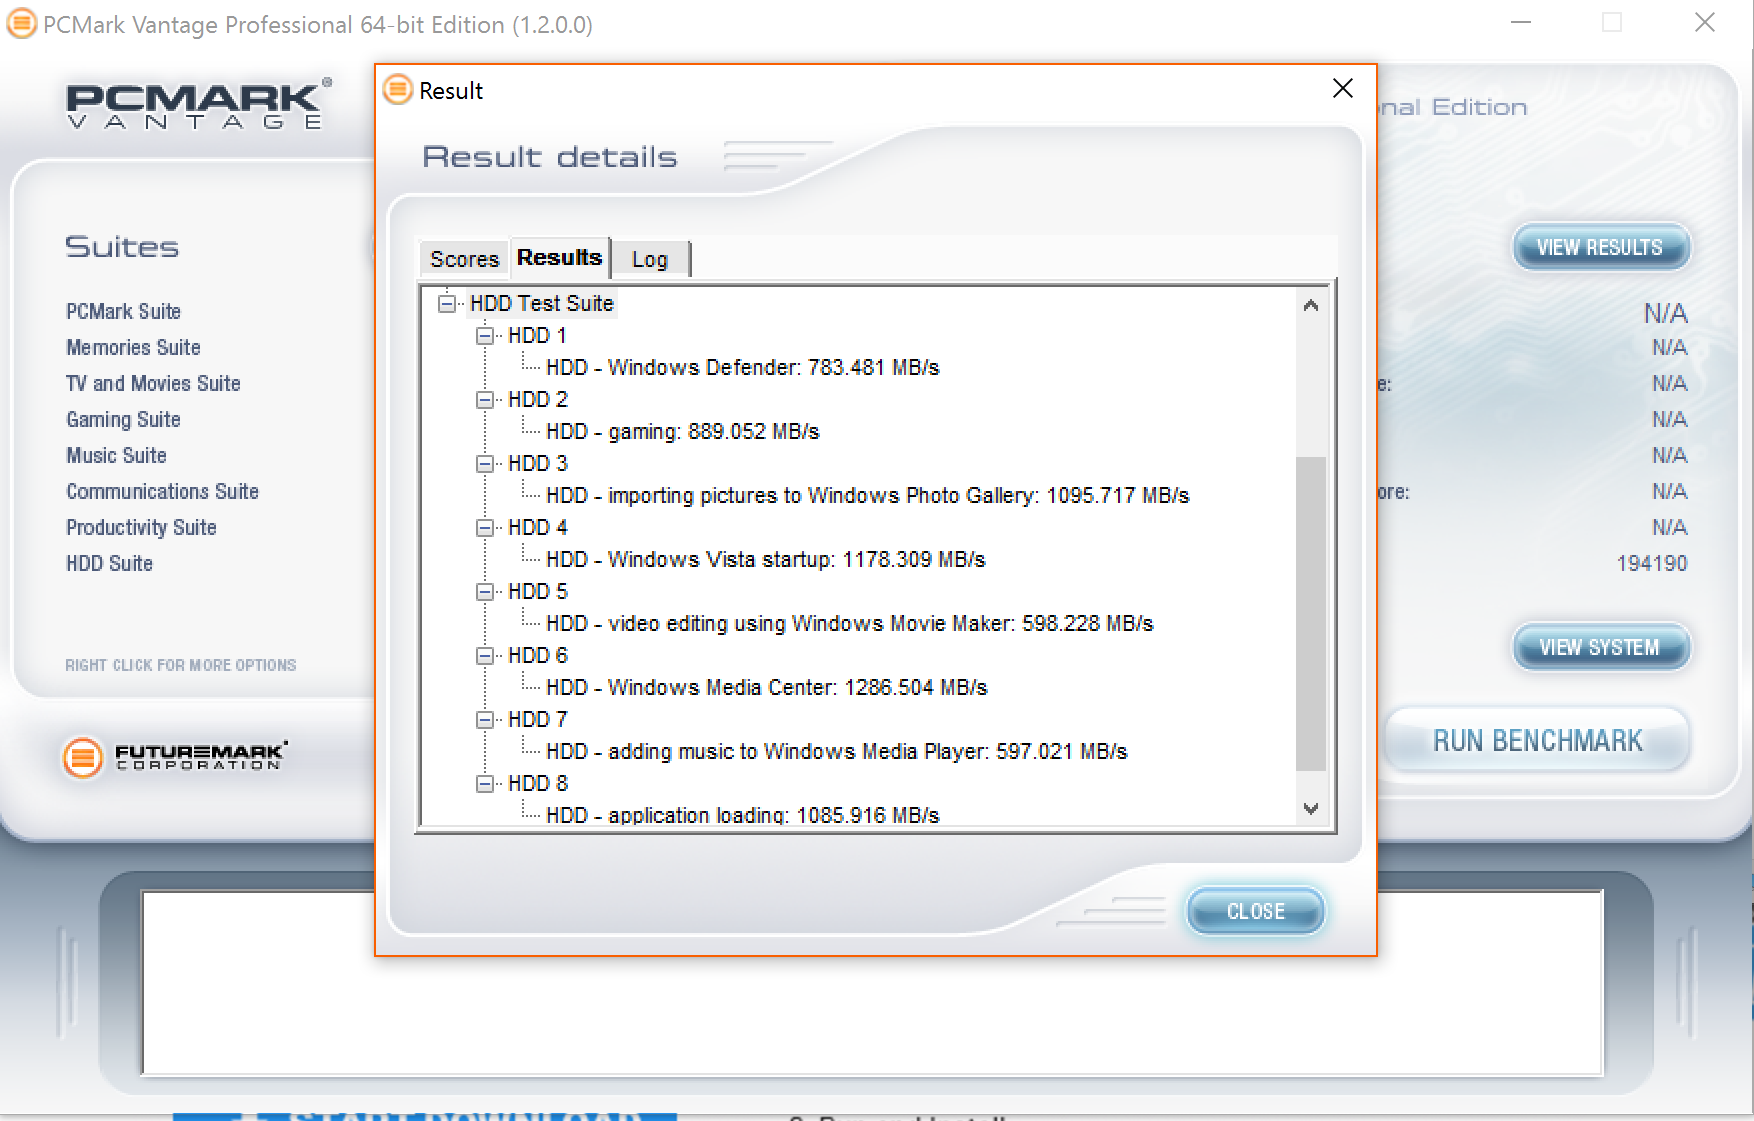
TOSHIBA XG5 1TB NVME M.2 PCIE SSD VANTAGE RESULTS
PCMark Vantage displayed impressive results with a high transfer speed of 1.2GB/s and four of the eight tests being above the 1GB/s data transfer speed threshold.
For our last benchmark, we have decided to use PCMark 8 Extended Storage Workload in order to determine steady state throughput of the SSD. This software is the longest in our battery of tests and takes just under 18 hours per SSD. As this is a specialized component of PCMark 8 Professional, its final result is void of any colorful graphs or charts typical of the normal online results and deciphering the resulting excel file into an easily understood result takes several more hours.
There are 18 phases of testing throughout the entire run, 8 runs of the Degradation Phase, 5 runs of the Steady State Phase and 5 runs of the Recovery Phase. In each phase, several performance tests are run of 10 different software programs; Adobe After Effects, Illustrator, InDesign, Photoshop Heavy and Photoshop Light, Microsoft Excel, PowerPoint and Word, as well as Battlefield 3 and World of Warcraft to cover the gaming element.
- PRECONDITIONING -The entire SSD is filled twice sequentially with random data of a 128KB file size. The second run accounts for overprovisioning that would have escaped the first;
- DEGRADATION PHASE – The SSD is hit with random writes of between 4KB and 1MB for 10 minutes and then a single pass performance test is done of each application. The cycle is repeated 8 times, and with each time, the duration of random writes increases by 5 minutes;
- STEADY STATE PHASE – The drive is hit with random writes of between 4KB and 1MB for 45 minutes before each application is put through a performance test. This process is repeated 5 times;
- RECOVERY PHASE – The SSD is allowed to idle for 5 minutes before and between performance tests of all applications. This is repeated 5 times which accounts for garbage collection; and
- CLEANUP – The entire SSD is written with zero data at a write size of 128KB
In reading the results, the Degrade and Steady State phases represent heavy workload testing while the recovery phase represents typical consumer light workload testing.
As you can see, performance is recorded in terms of Bandwidth and Latency. Bandwidth (or throughput) represents the total throughput the drive is able to sustain during the tests during each phase. Latency, at least for the purposes of PCMark 8, takes on a different outlook and for this, we will term it ‘Total Storage Latency’. Typically, latency has been addressed as the time it takes for a command to be executed, or rather, the time from when the last command completed to the time that the next command started. This is shown below as ‘Average Latency’.
PCMark 8 provides a slightly different measurement, however, that we are terming as ‘Total Storage Latency’. This is represented as being the period from the time the last command was completed, until the time it took to complete the next task; the difference of course being that the execution of that task is included in ‘Total Storage Latency’. For both latency graphs, the same still exists where the lower the latency, the faster the responsiveness of the system will be. While both latency charts look very similar, the scale puts into perspective how just a few milliseconds can increase the length of time to complete multiple workloads.
For a more in-depth look into Latency, Bandwidth, and IOPS check out our primer article on them here.
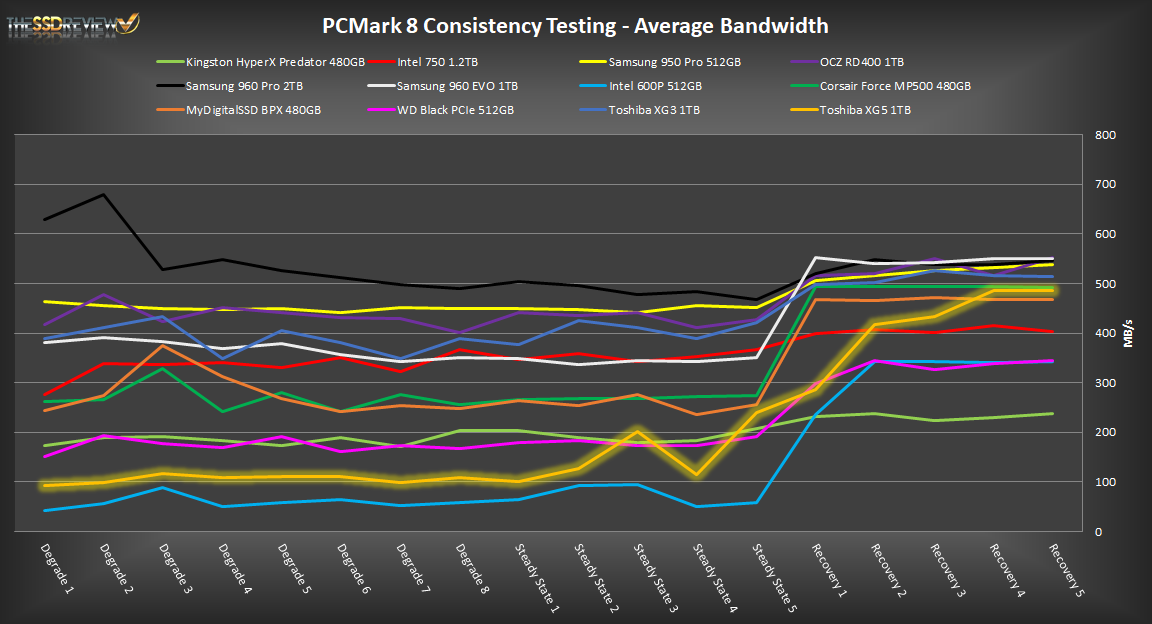
AVERAGE BANDWIDTH (OR THROUGHPUT)
These results show the total average bandwidth across all tests in the 18 phases. In this graph the higher the result the better.
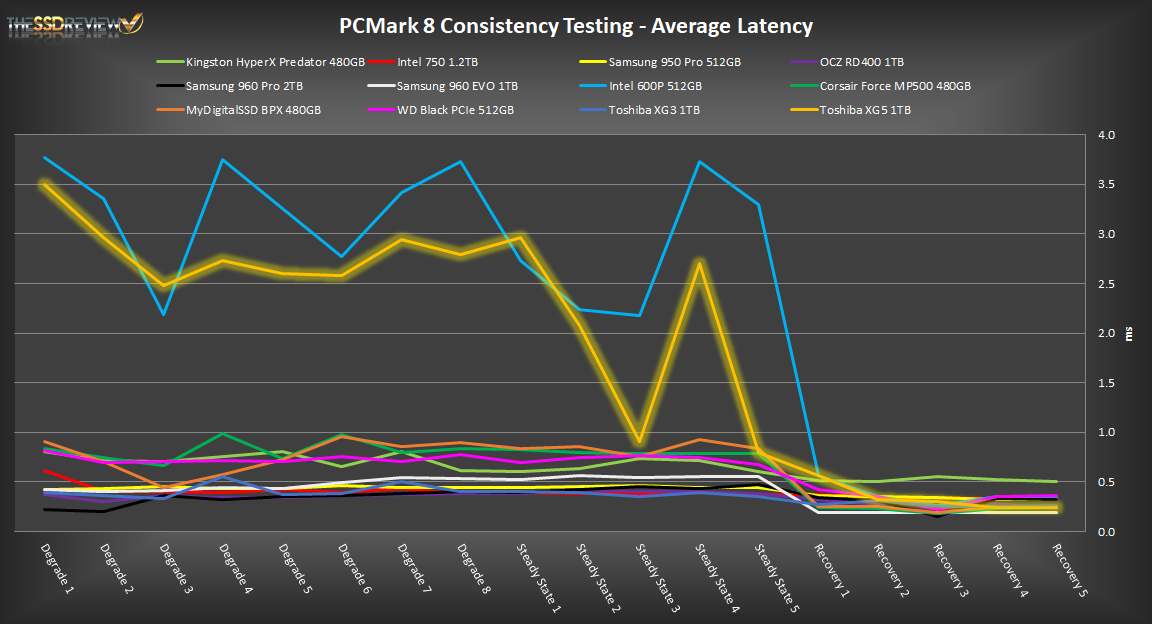
AVERAGE LATENCY (OR ACCESS TIME)
These results show the average access time during the workloads across all tests in the 18 phases. In this graph the lower the result the better.
This specific test definitely wasn’t the XG5’s strong point, leaving it just above the Intel P600 in performance. This is the reason we do several tests and anomalies like this do occur where a certain test may not work as it should with the SSD being tested.
Your PCMARK 8 RESULTS graphs are in the wrong order.
Also, I’d really like to see the power usage results! You seem to ignore posting them often for an unknown reason.
Thanks for that. I will switch them up. When I test, I don’t do the power testing. I leave it to Sean with his enterprise test regime. If he happens to do consumer drives, he will do the testing because he has the equipment right there in front of him.
Well I’ve found the most interesting metric so far about NVMe SSDs is
their power usage. I have been working to create a program to estimate the total cost of ownership. In other words, I take the lifespan of the largest drive and add in the cost of each drive plus electricity and if the lifespan is too short than the cost of buying a new drive (or drives), to see how much each drive *really* costs compared to it’s competitors.
This is a really cool metric no-one seems to care about. Sadly, no-body seems to give *all* the power info about a drive. Anandntech has started, but only the info for 2 or 3 drives is available.
Thanks for your reviews, and please encourage Sean!
Consumer and oem SSDs. The SSD will be replaced long before cost of ownership will be considered. Next up…power usage. It is not a major consideration, if any at all, with consumer SSD buyers. That is why we reserve our enterprise reviews for such. Don’t get me wrong. I am not discrediting you at all but, in most cases, SSDs are received only 3-4 days prior to when the embargo is when the report is to be released. Trust me when I say reviewers work their asses off to get an accurate report out in a very small period of time. It is not uncommon whatsoever to receive a SSD on Friday, without warning, for review release Monday morning…when you had a weekend planned. For many, the pay for doing such is very little if not non-existent. Many work on retention alone in the tech world. Just a peek into the SSD review lifestyle…
I totally understand. Its a cruel world sometimes.
What I have always wondered is, what happens if you get your review out 1 or 2 days after the embargo expires?
Let’s face it, you can give a better review if you have more time, plus you can think about what you are writing vs. being in a mad rush.
Personally, I typically am the last person to have an opinion on a given topic, but mine are far more accurate because I do the research and take the time to go through all of what I know and have learned.