
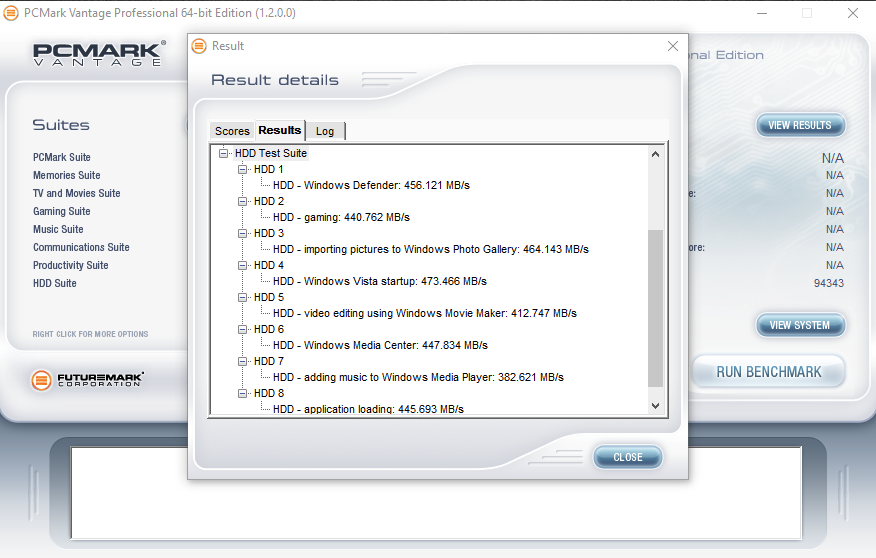
The SSD Review uses benchmark software called PCMark Vantage x64 HDD Suite to create testing scenarios that might be used in the typical user experience. There are eight tests in all and the tests performed record the speed of data movement in MB/s to which they are then given a numerical score after all of the tests are complete. The simulations are as follows:
- Windows Defender In Use
- Streaming Data from storage in games such as Alan Wake which allows for massive worlds and riveting non-stop action
- Importing digital photos into Windows Photo Gallery
- Starting the Vista Operating System
- Home Video editing with Movie Maker which can be very time consuming
- Media Center which can handle video recording, time shifting and streaming from Windows media center to an extender such as Xbox
- Cataloging a music library
- Starting applications
PCMARK VANTAGE RESULTS
The Zotac Premium Edition SSD delivers a very high score of 94,343 points for PCMark Vantage! Almost all benchmark speeds here exceeded 400MB/s and reached up to 473MB/s in the Windows Vista start up benchmark and performance the worst in the Windows Media Player benchmark reaching 383MB/s. These are all very, very good results! Let’s see how it compares to other SSDs in PCMark 8’s extended testing!
For our last benchmark, we have decided to use PCMark 8 Extended Storage Workload in order to determine steady state throughput of the SSD. This software is the longest in our battery of tests and takes just under 18 hours per SSD. As this is a specialized component of PCMark 8 Professional, its final result is void of any colorful graphs or charts typical of the normal online results and deciphering the resulting excel file into an easily understood result takes several more hours.
There are 18 phases of testing throughout the entire run, 8 runs of the Degradation Phase, 5 runs of the Steady State Phase and 5 runs of the Recovery Phase. In each phase, several performance tests are run of 10 different software programs; Adobe After Effects, Illustrator, InDesign, Photoshop Heavy and Photoshop Light, Microsoft Excel, PowerPoint and Word, as well as Battlefield 3 and World of Warcraft to cover the gaming element.
- PRECONDITIONING -The entire SSD is filled twice sequentially with random data of a 128KB file size. The second run accounts for overprovisioning that would have escaped the first;
- DEGRADATION PHASE – The SSD is hit with random writes of between 4KB and 1MB for 10 minutes and then a single pass performance test is done of each application. The cycle is repeated 8 times, and with each time, the duration of random writes increases by 5 minutes;
- STEADY STATE PHASE – The drive is hit with random writes of between 4KB and 1MB for 45 minutes before each application is put through a performance test. This process is repeated 5 times;
- RECOVERY PHASE – The SSD is allowed to idle for 5 minutes before and between performance tests of all applications. This is repeated 5 times which accounts for garbage collection; and
- CLEANUP – The entire SSD is written with zero data at a write size of 128KB
In reading the results, the Degrade and Steady State phases represent heavy workload testing while the recovery phase represents typical consumer light workload testing.
As you can see, performance is recorded in terms of Bandwidth and Latency. Bandwidth (or throughput) represents the total throughput the drive is able to sustain during the tests during each phase. Latency, at least for the purposes of PCMark 8, takes on a different outlook and for this, we will term it ‘Total Storage Latency’. Typically, latency has been addressed as the time it takes for a command to be executed, or rather, the time from when the last command completed to the time that the next command started. This is shown below as ‘Average Latency’.
PCMark 8 provides a slightly different measurement, however, that we are terming as ‘Total Storage Latency’. This is represented as being the period from the time the last command was completed, until the time it took to complete the next task; the difference of course being that the execution of that task is included in ‘Total Storage Latency’. For both latency graphs, the same still exists where the lower the latency, the faster the responsiveness of the system will be. While both latency charts look very similar, the scale puts into perspective how just a few milliseconds can increase the length of time to complete multiple workloads.
For a more in-depth look into Latency, Bandwidth, and IOPS check out our primer article on them here.
AVERAGE BANDWIDTH (OR THROUGHPUT)
These results show the total average bandwidth across all tests in the 18 phases. In this graph the higher the result the better.

AVERAGE LATENCY (OR ACCESS TIME)
These results show the average access time during the workloads across all tests in the 18 phases. In this graph the lower the result the better.
TOTAL STORAGE LATENCY
These results show the total access time across all tests in the 18 phases. In this graph the lower the result the better.
In our PCMark 8 consistency testing the Zotac Premium Edition SSD fairs very well. As we can see, performance is on par with some of the popular mid-tier SSDs. Under heavy workloads it even beats out the competition, save for the high-end SanDisk Extreme Pro and OCZ Vector 180. When it comes to light workload performance in the recovery phase we can see that performance increases and beats out the lower capacity Kingston HyperX with a similar component layout, but is still behind Samsung 850 EVO, OCZ Vector, Adata SX930, and SanDisk Extreme Pro. Overall, the Zotac Premium Edition SSD delivers very consistent performance and this benchmark further validates this SSD’s top performing market position. .
Phison’s very reputable quad-core S10 controller and Toshiba’s A19 MLC NAND. Win Win!!!
Keep up the good work Zotac. Who said that mlc could not be affordable?
Your price links take you to the ocz trion page.
Fixed, thank you!
I can’t believe Seagate just announced their 10 gig per sec ssd drives most likely for enterprise, probably consumer ones to follow.
Zotac Premium Edition SSDs DO INDEED have a SSD Toolbox Utility:
https://www.zotac.com/us/files/download/by_product?p_nid=501163&driver_type=235&os=246&=View+results
Finally, another excellent SSD with power and data path protection, and it definitely outperforms the Crucial MX100!
Dave