
The SSD Review uses benchmark software called PCMark Vantage x64 HDD Suite to create testing scenarios that might be used in the typical user experience. There are eight tests in all and the tests performed record the speed of data movement in MB/s to which they are then given a numerical score after all of the tests are complete. The simulations are as follows:
- Windows Defender In Use
- Streaming Data from storage in games such as Alan Wake which allows for massive worlds and riveting non-stop action
- Importing digital photos into Windows Photo Gallery
- Starting the Vista Operating System
- Home Video editing with Movie Maker which can be very time consuming
- Media Center which can handle video recording, time shifting and streaming from Windows media center to an extender such as Xbox
- Cataloging a music library
- Starting applications
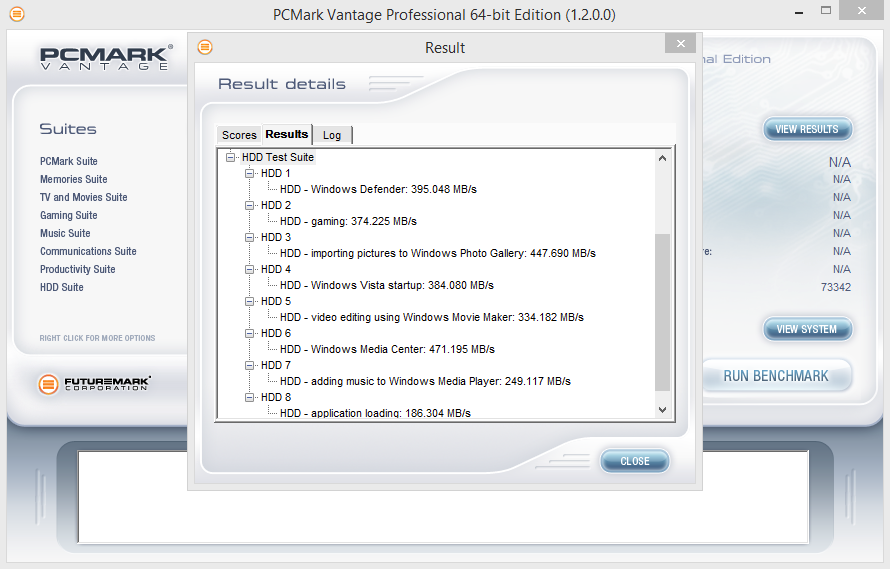
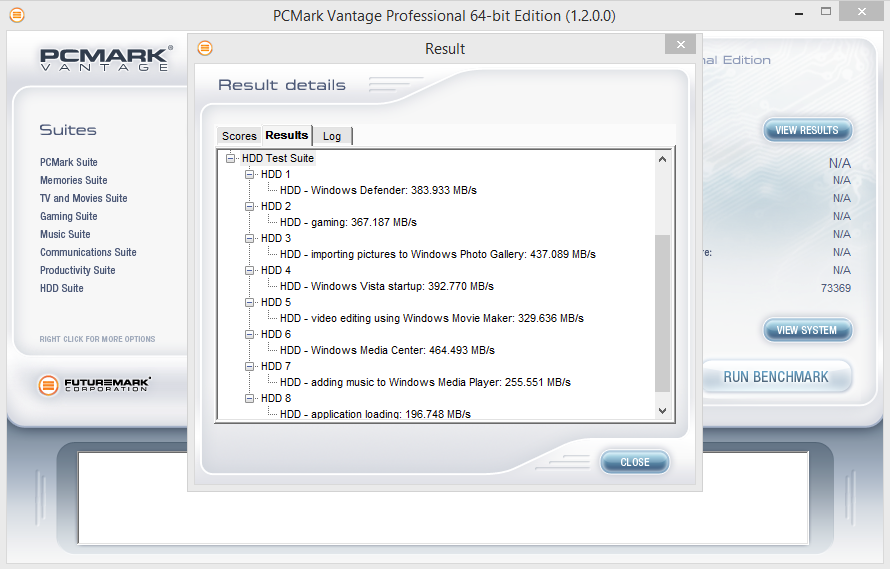
PCMARK VANTAGE RESULTS
We can see a continuation of the performance pattern between all the capacities in PCMark Vantage. All capacities achieved a Total Score of about 73K. All models achieved their highest speed during the “Windows Media Center” test and their lowest during the “application loading” test. This performance usually lands in the mainstream category of SSDs, however, benchmarks up until now prove it to be up there with some of the best. Let’s move on to PCMark 8’s consistency test and see where the Vector 180 lies there.
240GB
480GB
960GB

For our last benchmark, we have decided to use PCMark 8 Extended Storage Workload in order to determine steady state throughput of the SSD. This software is the longest in our battery of tests and takes just under 18 hours per SSD. As this is a specialized component of PCMark 8 Professional, its final result is void of any colorful graphs or charts typical of the normal online results and deciphering the resulting excel file into an easily understood result takes several more hours.
There are 18 phases of testing throughout the entire run, 8 runs of the Degradation Phase, 5 runs of the Steady State Phase and 5 runs of the Recovery Phase. In each phase, several performance tests are run of 10 different software programs; Adobe After Effects, Illustrator, InDesign, Photoshop Heavy and Photoshop Light, Microsoft Excel, PowerPoint and Word, as well as Battlefield 3 and World of Warcraft to cover the gaming element.
- PRECONDITIONING -The entire SSD is filled twice sequentially with random data of a 128KB file size. The second run accounts for overprovisioning that would have escaped the first;
- DEGRADATION PHASE – The SSD is hit with random writes of between 4KB and 1MB for 10 minutes and then a single pass performance test is done of each application. The cycle is repeated 8 times, and with each time, the duration of random writes increases by 5 minutes;
- STEADY STATE PHASE – The drive is hit with random writes of between 4KB and 1MB for 45 minutes before each application is put through a performance test. This process is repeated 5 times;
- RECOVERY PHASE – The SSD is allowed to idle for 5 minutes before and between performance tests of all applications. This is repeated 5 times which accounts for garbage collection; and
- CLEANUP – The entire SSD is written with zero data at a write size of 128KB
In reading the results, the Degrade and Steady State phases represent heavy workload testing while the recovery phase represents typical consumer light workload testing.
As you can see, performance is recorded in terms of Bandwidth and Latency. Bandwidth (or throughput) represents the total throughput the drive is able to sustain during the tests during each phase. Latency, at least for the purposes of PCMark 8, takes on a different outlook and for this, we will term it ‘Total Storage Latency’. Typically, latency has been addressed as the time it takes for a command to be executed, or rather, the time from when the last command completed to the time that the next command started. This is shown below as ‘Average Latency’.
PCMark 8 provides a slightly different measurement, however, that we are terming as ‘Total Storage Latency’. This is represented as being the period from the time the last command was completed, until the time it took to complete the next task; the difference of course being that the execution of that task is included in ‘Total Storage Latency’. For both latency graphs, the same still exists where the lower the latency, the faster the responsiveness of the system will be. While both latency charts look very similar, the scale puts into perspective how just a few milliseconds can increase the length of time to complete multiple workloads.
For a more in-depth look into Latency, Bandwidth, and IOPS check out our primer article on them here.
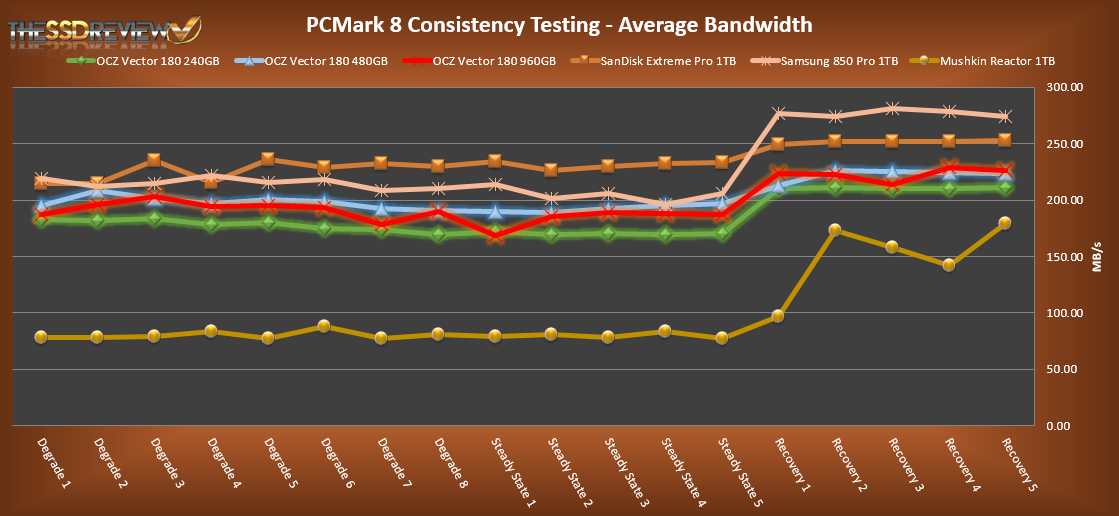
AVERAGE BANDWIDTH (OR THROUGHPUT)
These results show the total average bandwidth across all tests in the 18 phases. In this graph the higher the result the better.
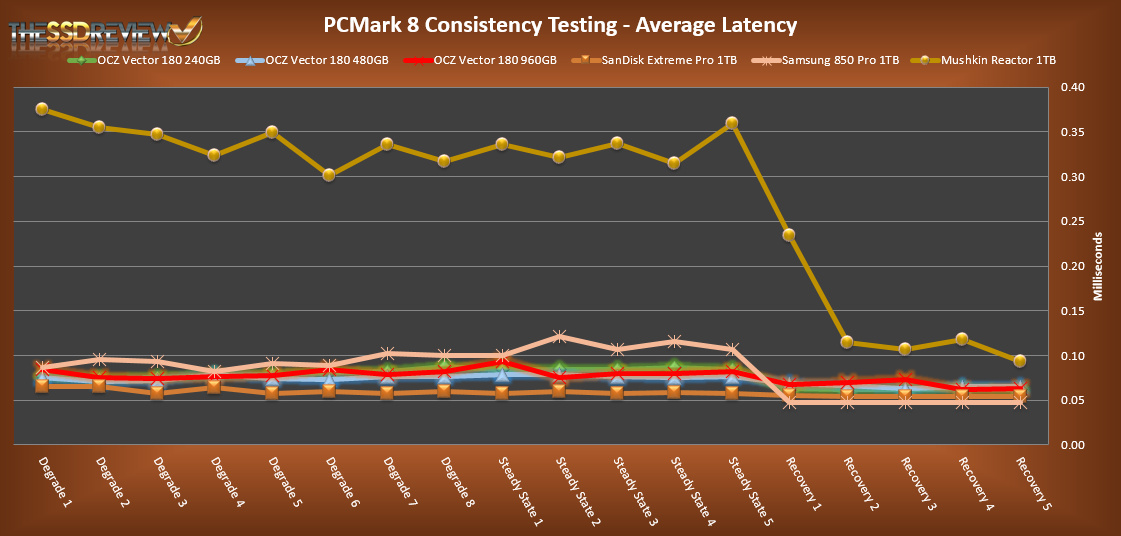
AVERAGE LATENCY (OR ACCESS TIME)
These results show the average access time during the workloads across all tests in the 18 phases. In this graph the lower the result the better.
TOTAL STORAGE LATENCY
These results show the total access time across all tests in the 18 phases. In this graph the lower the result the better.
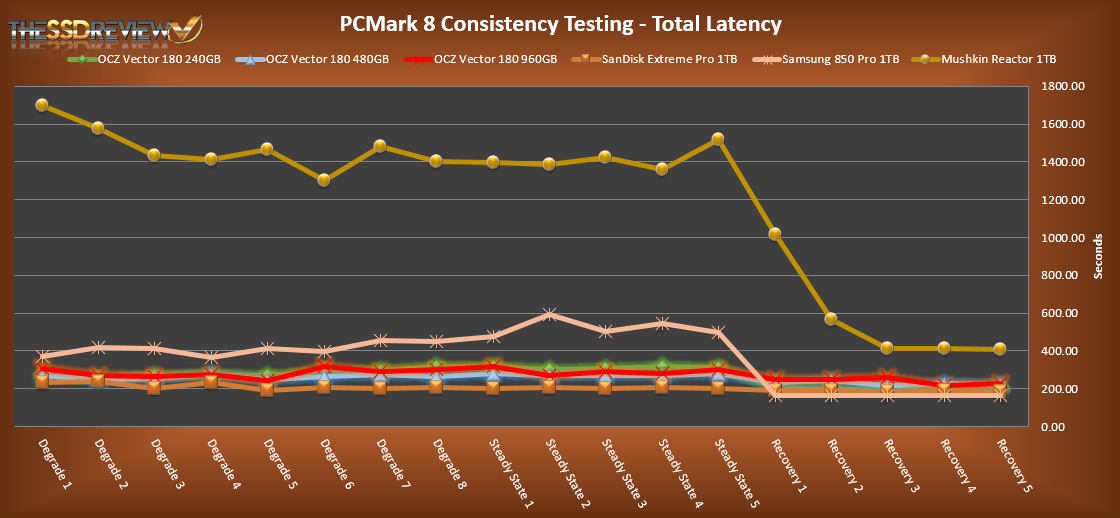 The OCZ Vector 180 family does not disappoint when it comes to PCMark 8 testing! We can see throughout the test phases that the Vector 180 was able to maintain very good performance and strong consistency. For comparison we have two of the best consumer SSDs out as well as an entry level price 1TB model. In comparison we can see that the OCZ Vector, is able to deliver similar performance to that of the SanDisk Extreme Pro and even beats out the Samsung 850 Pro during the heavy workload phases. When it comes to the recovery stages it continues to hold its own and we can see just how much better these enthusiast class SSDs are in terms of recovery and sheer performance. Even with the added complexity of design due to the PFM+ this feature does not seem to take a toll on real world performance, just as OCZ stated. PCMark 8 shows that the constant metadata mapping table DRAM buffer flushing is only apparent during synthetic benchmarks and not during more real world application based benchmarks. Overall, it did a great job here.
How long is it going to be before we forget-
“Friends DON’T let friends OCZ” ??????????
oh yeah, that’s so eighties…
PC Perspective threw an interesting monkey wrench at this device.
“With firmware 1.01 (current as of this writing), the Vector 180 halts every 20 seconds during sustained writes. TRIM operations also result in obvious stalls in subsequent host writes.”
Our final outlook of this SSD is determinate of all tests, the most demanding of which is PCMark 8. PCMark 8 puts the SSD through 18 hours of the most grueling activity, and well above consumer demands. The best part of independent testing is that there is always more than a single review to rely on. Obviously, we had a great respect for this SSD with the firmware on hand.
Why is the Mushkin Reactor in the consistency bandwidth charts with these drives when it is low to middle tier and the rest are top of the line ssds? Why not show the top of the line Mushkin Striker comparison instead?
I included the reactor to show a comparison to how an entry level SSD stands against the top tier SSDs. We also do not have a mushkin striker to compare.
Ok sounds good. Could you test an compare some of the new top brand ssds ? Mushkin Striker, Pny cs2111, Patriot Blaze, Corsair Neutron XT? I would like to see consistency bandwidth comparisons for these ssds. This way we can see how the new controllers stack up against each other. I hope you get some soon!
It is nice to see a company provide 3 different capacities to review at the same time.
The PFM is interesting but as stated it does not protect the data itself. You won’t have a bricked SSD but you’ll have corrupted data (and a full restore on your hands) if power is lost and the cache is holding write data. Supercaps are the only thing that will prevent that. Crucial showed that with the M500 series. Wish more companies jumped on that bandwagon.
How long will it take to forget-“Friends don’t let friends OCZ”