
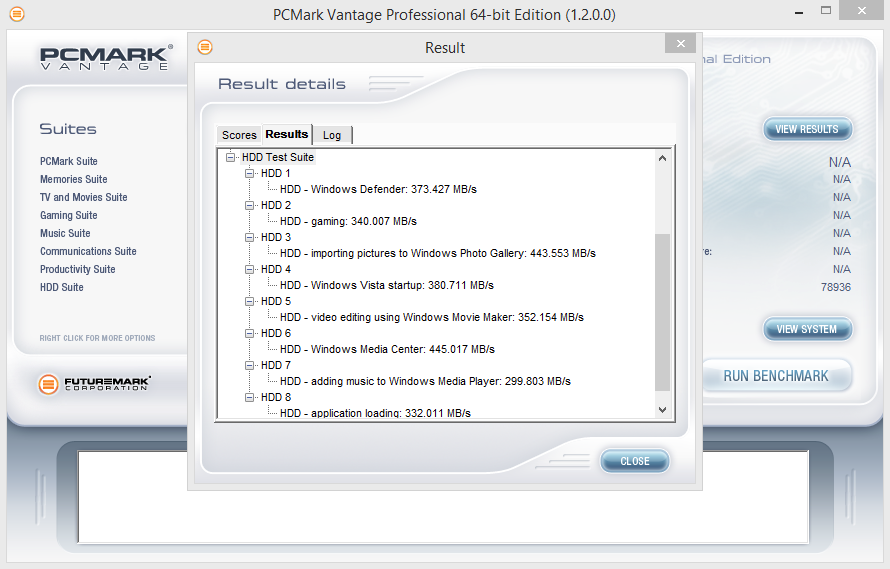
The SSD Review uses benchmark software called PCMark Vantage x64 HDD Suite to create testing scenarios that might be used in the typical user experience. There are eight tests in all and the tests performed record the speed of data movement in MB/s to which they are then given a numerical score after all of the tests are complete. The simulations are as follows:
- Windows Defender In Use
- Streaming Data from storage in games such as Alan Wake which allows for massive worlds and riveting non-stop action
- Importing digital photos into Windows Photo Gallery
- Starting the Vista Operating System
- Home Video editing with Movie Maker which can be very time consuming
- Media Center which can handle video recording, time shifting and streaming from Windows media center to an extender such as Xbox
- Cataloging a music library
- Starting applications
PCMARK VANTAGE RESULTS
Here in PCMark Vantage we see some variance among the results. Each of the capacities had very similar overall result numbers with the 250GB receiving a score of 78,936, the 500GB receiving a score of 74,957, and the 1TB receiving a score of 78,936 points. Both the 250GB and 500GB had their fastest speeds when using Windows Media center while Windows Vista startup was the test that peaked for the 1TB. However, all three capacities do have one thing in common and that is their test that they performed the lowest in, adding music to Windows Media Player. One interesting thing to note is that both the 500GB and 1TB have the exact same value, 257MB/s, for the tests they performed the worst in.
250GB
500GB

1TB

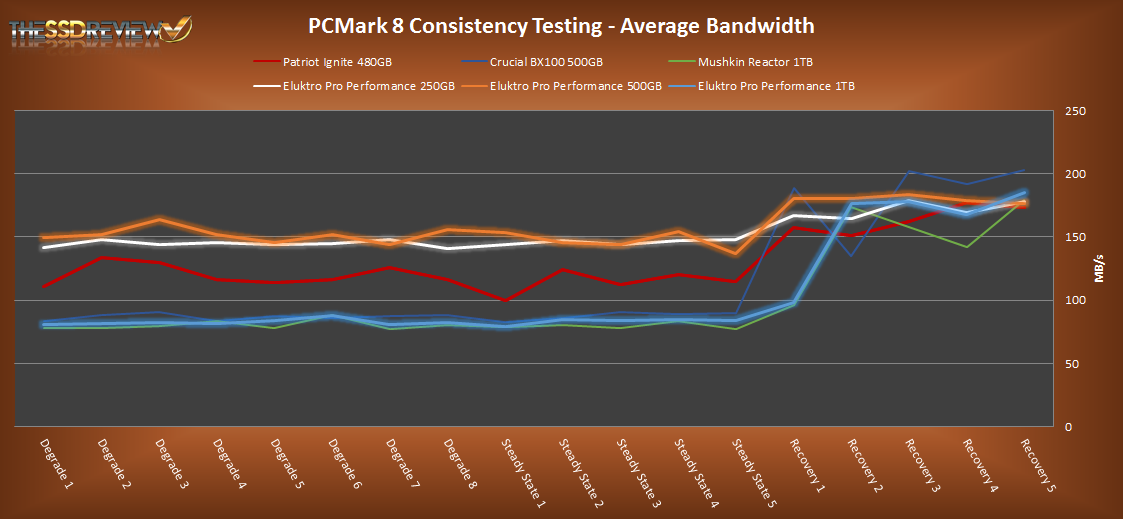
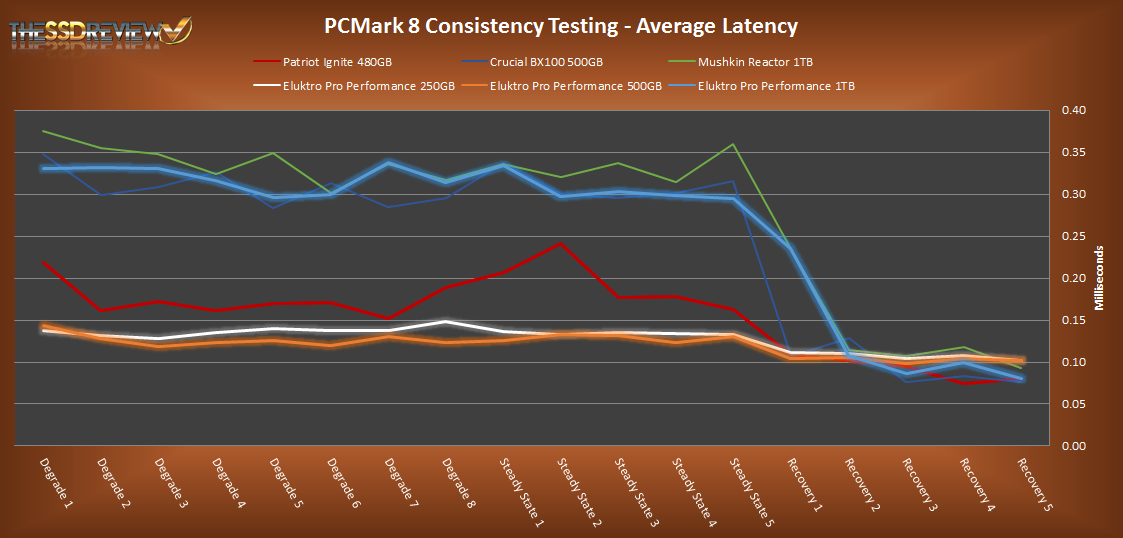
For our last benchmark, we have decided to use PCMark 8 Extended Storage Workload in order to determine steady state throughput of the SSD. This software is the longest in our battery of tests and takes just under 18 hours per SSD. As this is a specialized component of PCMark 8 Professional, its final result is void of any colorful graphs or charts typical of the normal online results and deciphering the resulting excel file into an easily understood result takes several more hours.
There are 18 phases of testing throughout the entire run, 8 runs of the Degradation Phase, 5 runs of the Steady State Phase and 5 runs of the Recovery Phase. In each phase, several performance tests are run of 10 different software programs; Adobe After Effects, Illustrator, InDesign, Photoshop Heavy and Photoshop Light, Microsoft Excel, PowerPoint and Word, as well as Battlefield 3 and World of Warcraft to cover the gaming element.
- PRECONDITIONING -The entire SSD is filled twice sequentially with random data of a 128KB file size. The second run accounts for overprovisioning that would have escaped the first;
- DEGRADATION PHASE – The SSD is hit with random writes of between 4KB and 1MB for 10 minutes and then a single pass performance test is done of each application. The cycle is repeated 8 times, and with each time, the duration of random writes increases by 5 minutes;
- STEADY STATE PHASE – The drive is hit with random writes of between 4KB and 1MB for 45 minutes before each application is put through a performance test. This process is repeated 5 times;
- RECOVERY PHASE – The SSD is allowed to idle for 5 minutes before and between performance tests of all applications. This is repeated 5 times which accounts for garbage collection; and
- CLEANUP – The entire SSD is written with zero data at a write size of 128KB
In reading the results, the Degrade and Steady State phases represent heavy workload testing while the recovery phase represents typical consumer light workload testing.
As you can see, performance is recorded in terms of Bandwidth and Latency. Bandwidth (or throughput) represents the total throughput the drive is able to sustain during the tests during each phase. Latency, at least for the purposes of PCMark 8, takes on a different outlook and for this, we will term it ‘Total Storage Latency’. Typically, latency has been addressed as the time it takes for a command to be executed, or rather, the time from when the last command completed to the time that the next command started. This is shown below as ‘Average Latency’.
PCMark 8 provides a slightly different measurement, however, that we are terming as ‘Total Storage Latency’. This is represented as being the period from the time the last command was completed, until the time it took to complete the next task; the difference of course being that the execution of that task is included in ‘Total Storage Latency’. For both latency graphs, the same still exists where the lower the latency, the faster the responsiveness of the system will be. While both latency charts look very similar, the scale puts into perspective how just a few milliseconds can increase the length of time to complete multiple workloads.
For a more in-depth look into Latency, Bandwidth, and IOPS check out our primer article on them here.
AVERAGE BANDWIDTH (OR THROUGHPUT)
These results show the total average bandwidth across all tests in the 18 phases. In this graph the higher the result the better.
AVERAGE LATENCY (OR ACCESS TIME)
These results show the average access time during the workloads across all tests in the 18 phases. In this graph the lower the result the better.
TOTAL STORAGE LATENCY
These results show the total access time across all tests in the 18 phases. In this graph the lower the result the better.

For the first test of PCMark 8 we have the average bandwidth. In this test we see that the SandForce driven Eluktronics Eluktro Pro Performance SSDs have relatively high bandwidth that only slightly deviates, overall the phases goes from around 150MB/s to 175MB/s. The 1TB has a much lower bandwidth for most of the phases and only equalizes with the other capacities in the last four phases. In the second test for average latency we see there is a similar trend to that of the first. Even more so the 250GB and 500GB don’t deviate much and have very low latency where the others start out high. The average latency for these smaller capacities goes from 0.15ms to 0.10ms over all the phases. The 1TB starts out around 0.33ms and again doesn’t equalize until the last four light workload phases. Overall, the SandForce SSDs seem to have a slight advantage here in the heavy workload phases while the Silicon Motion driven 1TB model performs slightly better in the light workload phases.
Good review. I have been waiting for a new review on a sandforce drive with synchronous nand. It seems a lot of reviews of sandforce drives are with asynchronous nand, I don’t know why. You hear a lot about Samsung, crucial, and all the 100 million different controllers. But not much about sandforce/Seagate I guess because it is considered old, but it works and real
life and consistency seem to be just as fast as the new controllers all without a dram buffer. I can’t wait for Seagate and micron to pair the new sandforce controller with some premium micron nand then we will have a real ssd!