
The SSD Review uses PCMark 8’s Storage test suite to create testing scenarios that might be used in the typical user experience. With 10 traces recorded from Adobe Creative Suite, Microsoft Office and a selection of popular games, it covers some of the most popular light to heavy workloads. Unlike synthetic storage tests, the PCMark 8 Storage benchmark highlights real-world performance differences between storage devices. After an initial break-in cycle and three rounds of the testing, we are given a file score and bandwidth amount. The higher the score/bandwidth, the better the drive performs.
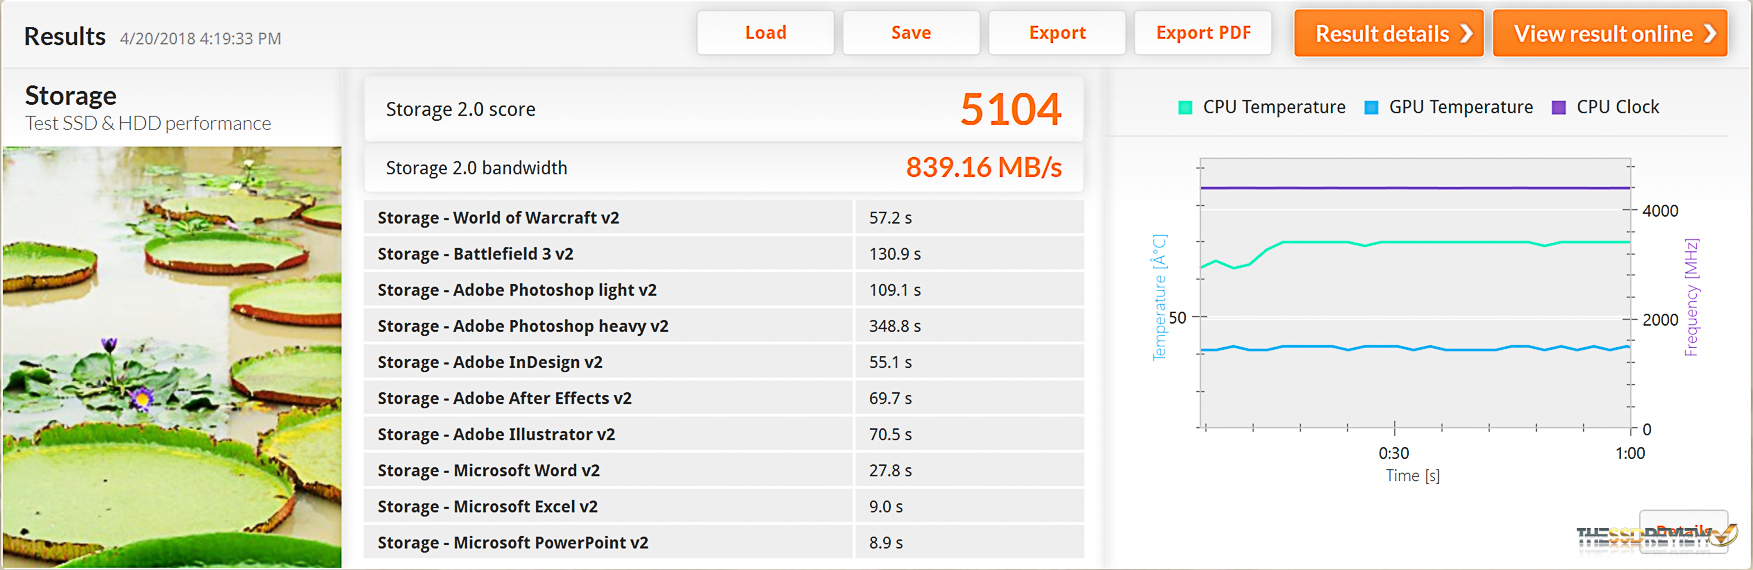
As our top dog in all but AIC and RAID testing had been the Samsung 960 Pro M.2 which held that spot for some time, we weren’t surprised when the 970 Pro came in with a commanding 5104 points and 839MB/s bandwidth.
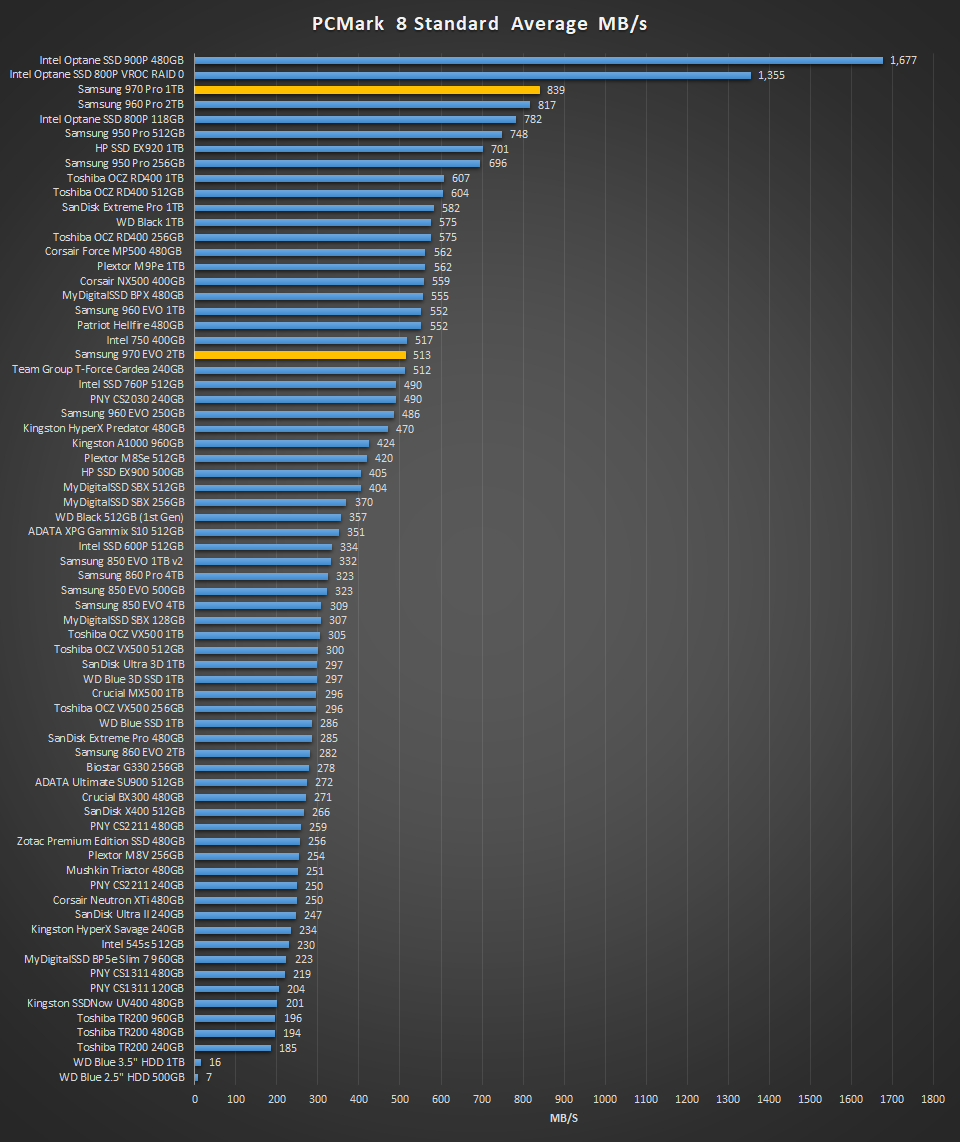
This even beat the Intel Optane 800P M.2 SSD, which might be expected as the Intel is only 118GB, vice 1TB.
PCMARK 8 EXTENDED STORAGE WORKLOAD CONSISTENCY TESTING
For our last benchmark, we have decided to use PCMark 8 Extended Storage Workload in order to determine steady-state throughput of the SSD. This software is the longest in our battery of tests and takes just under 18 hours per SSD. As this is a specialized component of PCMark 8 Professional, its final result is void of any colorful graphs or charts typical of the normal online results and deciphering the resulting excel file into an easily understood result takes several more hours.
There are 18 phases of testing throughout the entire run, 8 runs of the Degradation Phase, 5 runs of the Steady State Phase and 5 runs of the Recovery Phase. In each phase, several performance tests are run of 10 different software programs; Adobe After Effects, Illustrator, InDesign, Photoshop Heavy and Photoshop Light, Microsoft Excel, PowerPoint and Word, as well as Battlefield 3 and World of Warcraft to cover the gaming element.
- PRECONDITIONING -The entire SSD is filled twice sequentially with random data of a 128KB file size. The second run accounts for overprovisioning that would have escaped the first;
- DEGRADATION PHASE – The SSD is hit with random writes of between 4KB and 1MB for 10 minutes and then a single pass performance test is done of each application. The cycle is repeated 8 times, and with each time, the duration of random writes increases by 5 minutes;
- STEADY STATE PHASE – The drive is hit with random writes of between 4KB and 1MB for 45 minutes before each application is put through a performance test. This process is repeated 5 times;
- RECOVERY PHASE – The SSD is allowed to idle for 5 minutes before and between performance tests of all applications. This is repeated 5 times which accounts for garbage collection; and
- CLEANUP – The entire SSD is written with zero data at a write size of 128KB
In reading the results, the Degrade and Steady State phases represent heavy workload testing while the recovery phase represents typical consumer light workload testing.
As you can see, performance is recorded in terms of Bandwidth and Latency. Bandwidth (or throughput) represents the total throughput the drive is able to sustain during the tests during each phase. Latency, at least for the purposes of PCMark 8, takes on a different outlook and for this, we will term it ‘Total Storage Latency’. Typically, latency has been addressed as the time it takes for a command to be executed, or rather, the time from when the last command completed to the time that the next command started. This is shown below as ‘Average Latency’.
PCMark 8 provides a slightly different measurement, however, that we are terming as ‘Total Storage Latency’. This is represented as being the period from the time the last command was completed until the time it took to complete the next task; the difference, of course, is that the execution of that task is included in ‘Total Storage Latency’. For both latency graphs, the same still exists where the lower the latency, the faster the responsiveness of the system will be. While both latency charts look very similar, the scale puts into perspective how just a few milliseconds can increase the length of time to complete multiple workloads.
For a more in-depth look at Latency, Bandwidth, and IOPS check out our primer article on them here.
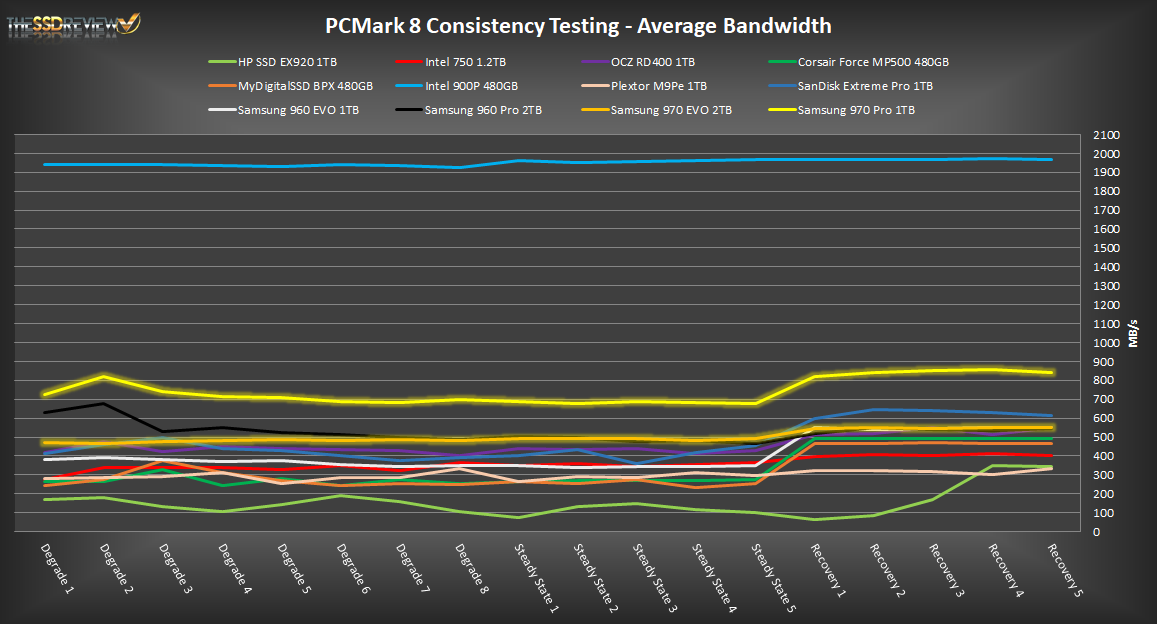
AVERAGE BANDWIDTH (OR THROUGHPUT)
These results show the total average bandwidth across all tests in the 18 phases. In this graph the higher the result the better.
AVERAGE LATENCY (OR ACCESS TIME)
These results show the average access time during the workloads across all tests in the 18 phases. In this graph the lower the result the better.
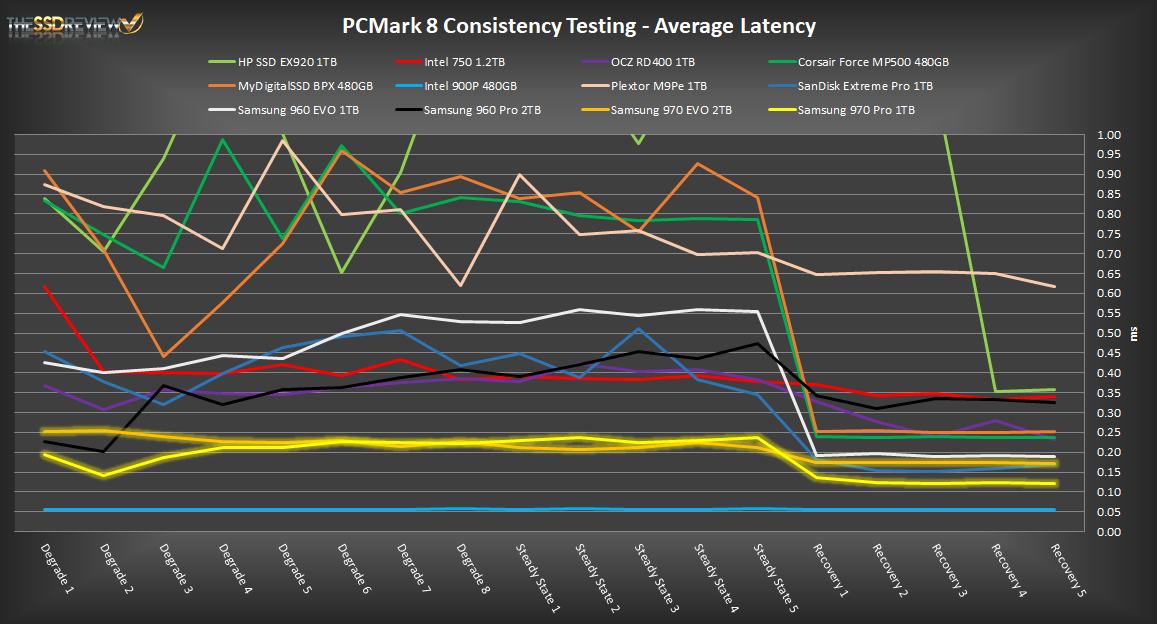
When examining, let’s take the Intel Optane 900P out of the equation right away as it is a HHHL AIC and it is just not a fair comparison with a M.2 SSD. The massive size difference between a half-height half-length SSD compared to a M.2 form factor just makes the playing field so unfair.
In this test, both the Samsung 970 Pro and EVO did better than any other M.2 SSD we have ever put through this grueling benchmark. Both have higher average bandwidth and lower latency throughout the just under 20 hours of this test. Looking at the 970 Pro specifically though, it is leaps and bounds ahead of the rest, especially when considering average bandwidth that, until now, hadn’t been heard of for M.2 SSD. Again best results yet!
THOSE 4 K NUMBERS AIN’T CONSISTENT ,ANVIL CAN’T BE RIGGED THEREFOR 60 MBPS RANDOM READS AND 200 WRITES IS MORE TO THE REALM,IT AINT THAT QUICK,I GET 3.56 GBPS READS FROM A FLAGSHIP OEM/IBM VARIANT,CRYSTAL SOFTWARE ,THAT DON’T MEAN I OUGHT TO ASSUME IT’S THE REAL WORLD,NO?
YOU FAILED TOIMENTION SPECIFIC DRIVERS USED IN THIS UNREAL CRYSTAL BENCH TEST,NO?
The 512GB version of the Samsung 970 PRO was indeed a bargain! I snagged one for $119.99 on Newegg with promo code a few months ago. While writes aren’t as great as the 1TB version, read speeds are over 3,200MB/sec & writes over 2,600MB/sec on my ASRock Z97 Extreme6 system. Both reads & writes improved big time over the 950 PRO of the same capacity (2300/1500MB/sec).
Can’t wait for the 980 PRO, which should introduce PCIe 4.0 support!