
SERVER PROFILES
While synthetic workloads do a great job of testing the underlying technology and reporting easy to understand results, they aren’t always indicative of how the drive will be used by the end user. Workloads that simulate enterprise environments try to bridge that gap without being overly complex.
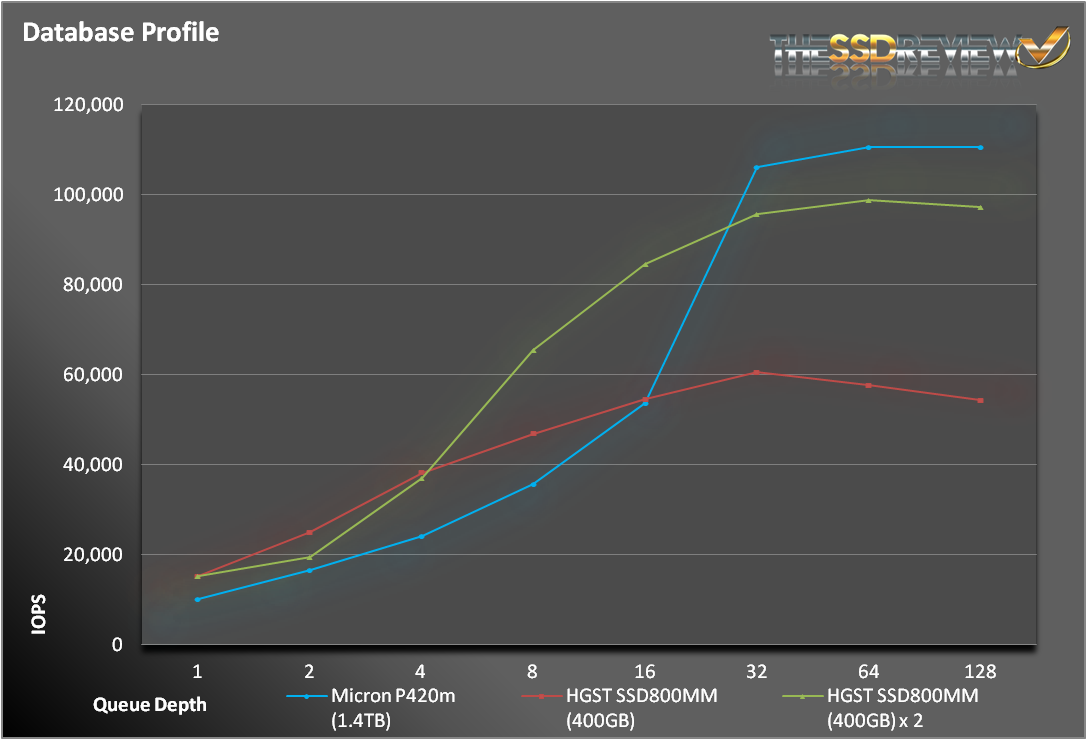
The database profile is 8K transfers, and 67% percent of operations are reads.
For our database profile, the P420m eventually overtook the HGST SSDs, but only at higher queue depths. At lower queue depth, both HGST configurations won out.
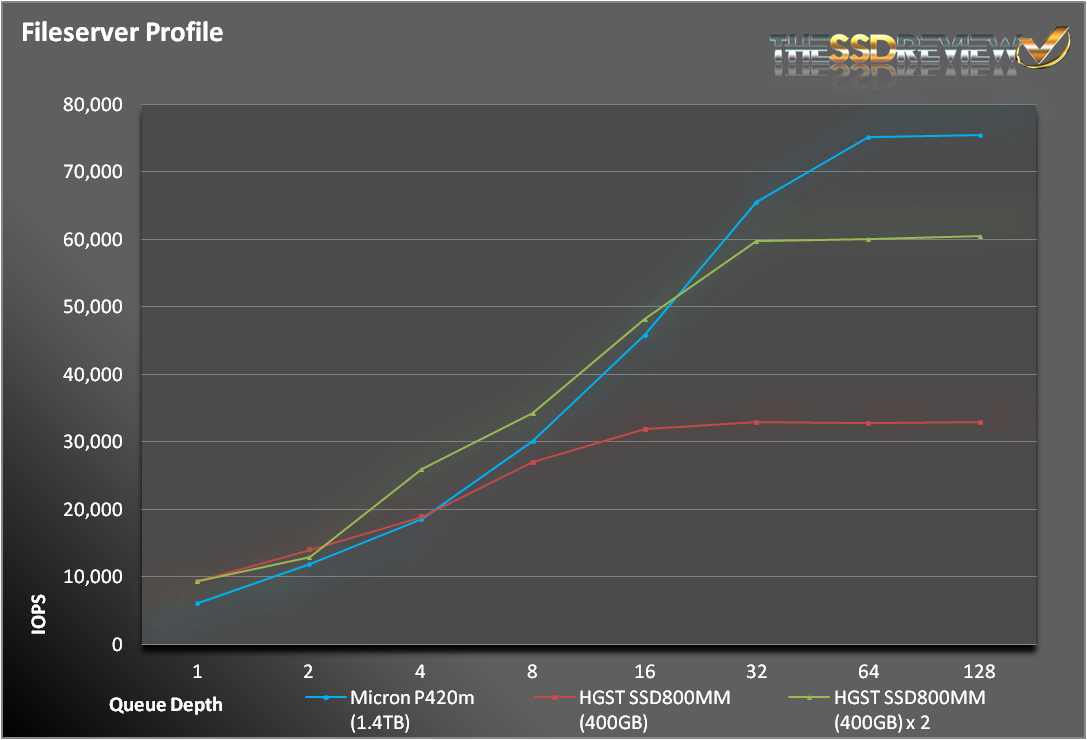
The fileserver profile is based on an 80% read/20% write mix. Its made up of blocksizes from 512 to 64K, each making up a different percentage of the access pattern.
The pattern is: 512 bytes=10%, 1k=5%,2k=5%, 4k=60%, 8k=2%, 16k=4%, 32k=4%, 64k=10%.
At lower queue depths, all 3 configurations performed equally well. Just like with our database access pattern, the P420m flexed its muscle once the queue depths reached 32.
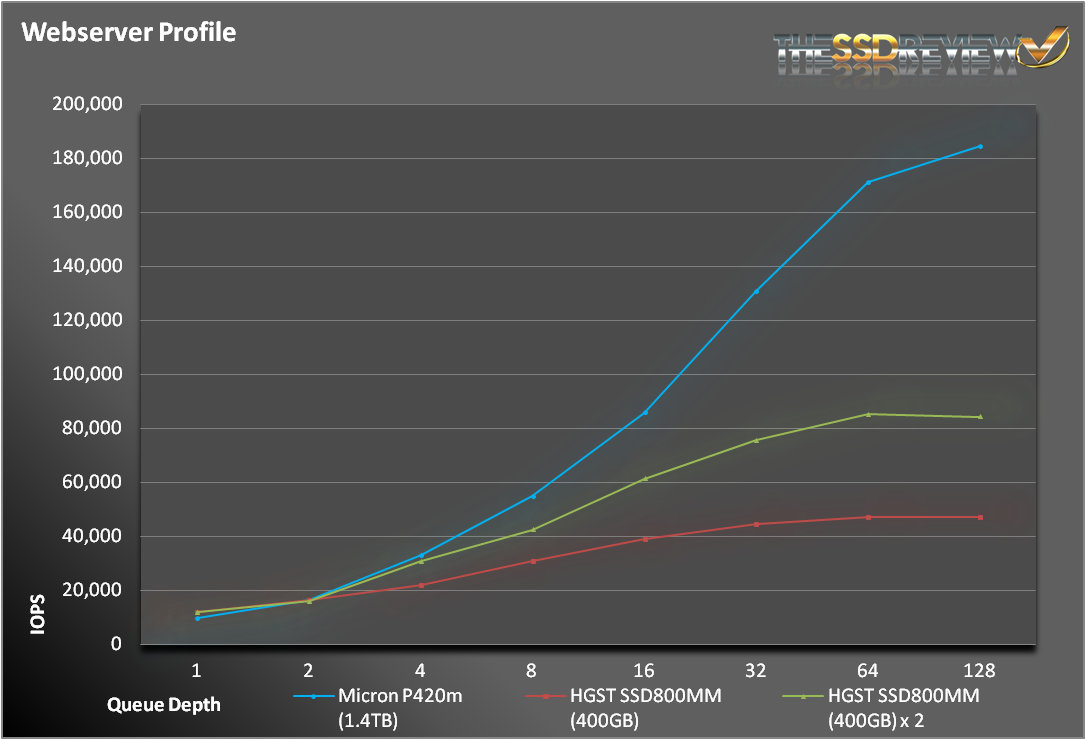
The webserver profile is similar to the fileserver profile, but has some additional 128K and 512K accesses thrown in for good measure. Additionally, the profile is 100% read.
This wasn’t much of a fight. These are the sort of tests the P420m was made for. As a pure read test, the SSD800MMs were no match for the P420m, easily outpacing them at all queue depths.
The server workloads only reinforce the results on previous tests. When looking at heavily influenced read tests, there is no equal to the P420m. When tests start to skew towards write operations, the HGST drives can definitely hold their own.
Great review. Did you know tweaktown got Sandisk’s A110 PCIe SSD to review?
Yes…as well as Tom’s. It sometimes works like that and, if you stay tuned, you may see an exclusive M.2 report in the near future that we were lucky to grab.
page four, blue graph at the bottom (4K Read Steady State, 1 Hr at QD256) shows “LATENCY (ms)” in the left vertical axis name with values from 700.000 to 800.000.
Obviously it’s NOT latency, but it is IOPS which is really fantastic result. The sentence right below the graph clearly says this, I just wanted to point out as I know Les reads these comments and I’m pretty sure he will correct the graph very quickly.
And for sure, target audience knows to separate apples from oranges so it’s really obvious for us. Not too much average Joes are going to buy 1.4TB PCIe drive for three thousands to speed up loading of Windows 7 or Near Cry or whatever the game name is 🙂
Thank you for pointing that out! Will get to it.
How do you make this nice charts ?
Does it support NVMe?
this drive does not report TRIM support 🙁