
The Storage Networking Industry Association has an entire industry accepted performance test specification for solid state storage devices. Some of the tests are complicated to perform, but they allow us to look at some important performance metrics in a standard, objective way.
SNIA’s Performance Test Specification (PTS) includes IOPS testing, but it is much more comprehensive than just running 4KB writes with IOMeter. SNIA testing is more like a marathon than a sprint. In total, there are 25 rounds of tests, each lasting 56 minutes. Each round consists of 8 different block sizes (512 bytes through 1MB) and 7 different access patterns (100% reads to 100% writes). After 25 rounds are finished (just a bit longer than 23 hours), we record the average performance of 4 rounds after we enter steady state.
- Preconditioning: 3x capacity fill with 128K sequential writes
- Each round is composed of .5K, 4K, 8K, 16K, 32K, 64K, 128K, and 1MB accesses
- Each access size is run at 100%, 95%, 65%, 50%, 35%, 5%, and 0% Read/Write Mixes, each for one minute.
- The test is composed of 25 rounds (one round takes 56 minutes, 25 rounds = 1,400 minutes)
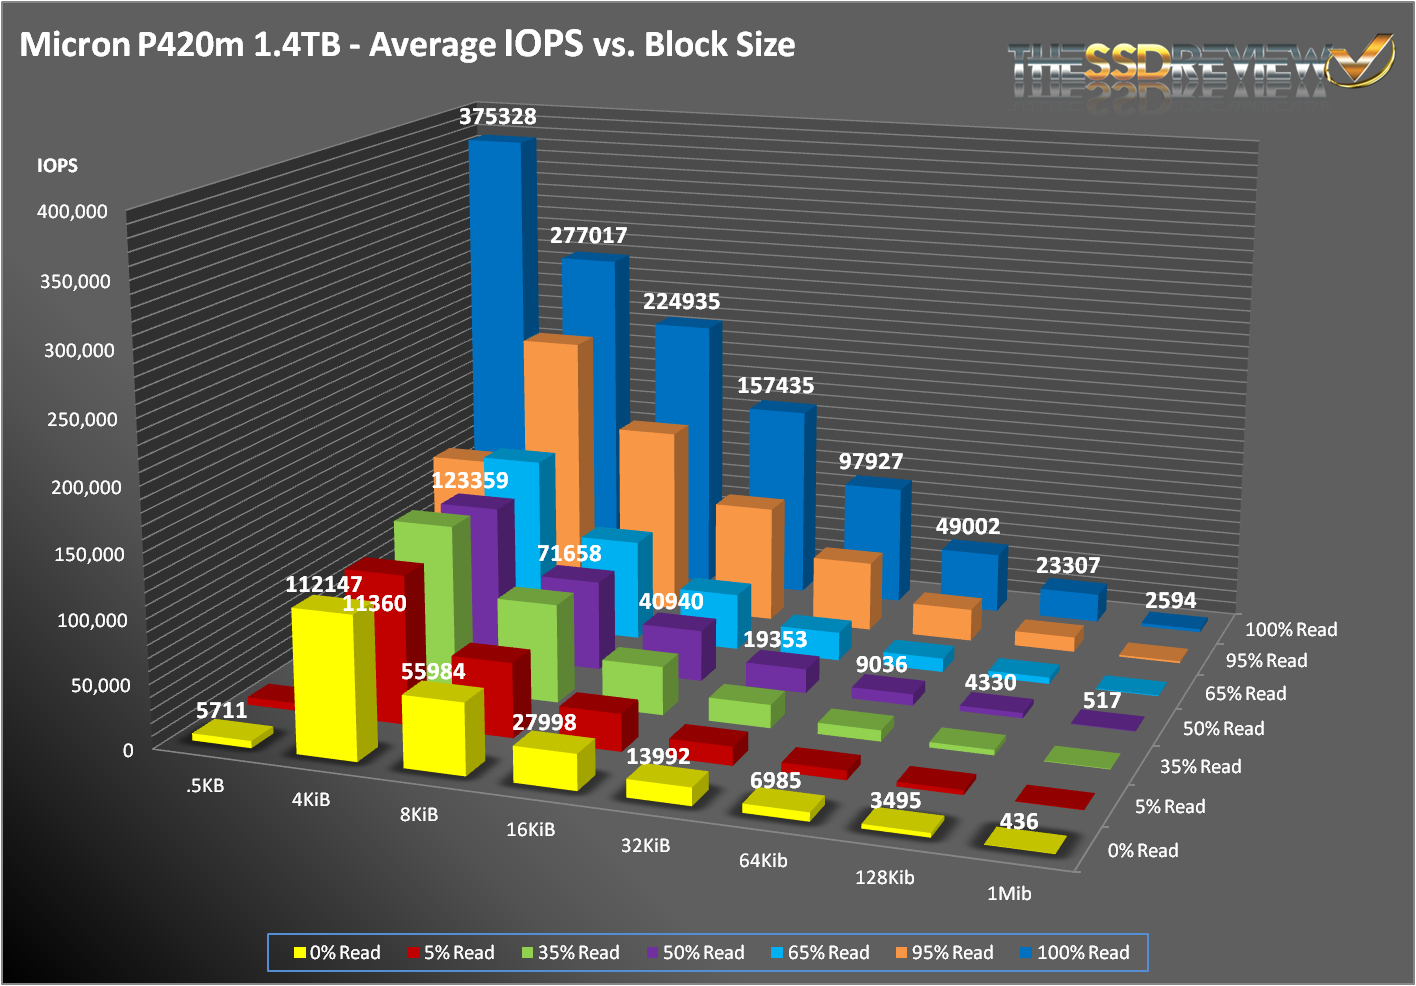
Normally, we run our SNIA tests at a queue depth of 32. For SATA/SAS devices, this is almost always adequate. But, as you can see from the graph above, the performance was well below the specification. Since the P420m’s controller offers a great amount of parallelism, it doesn’t reach its full potential until 256 outstanding IOs. So, we reran our test at that queue depth to see what it could achieve.
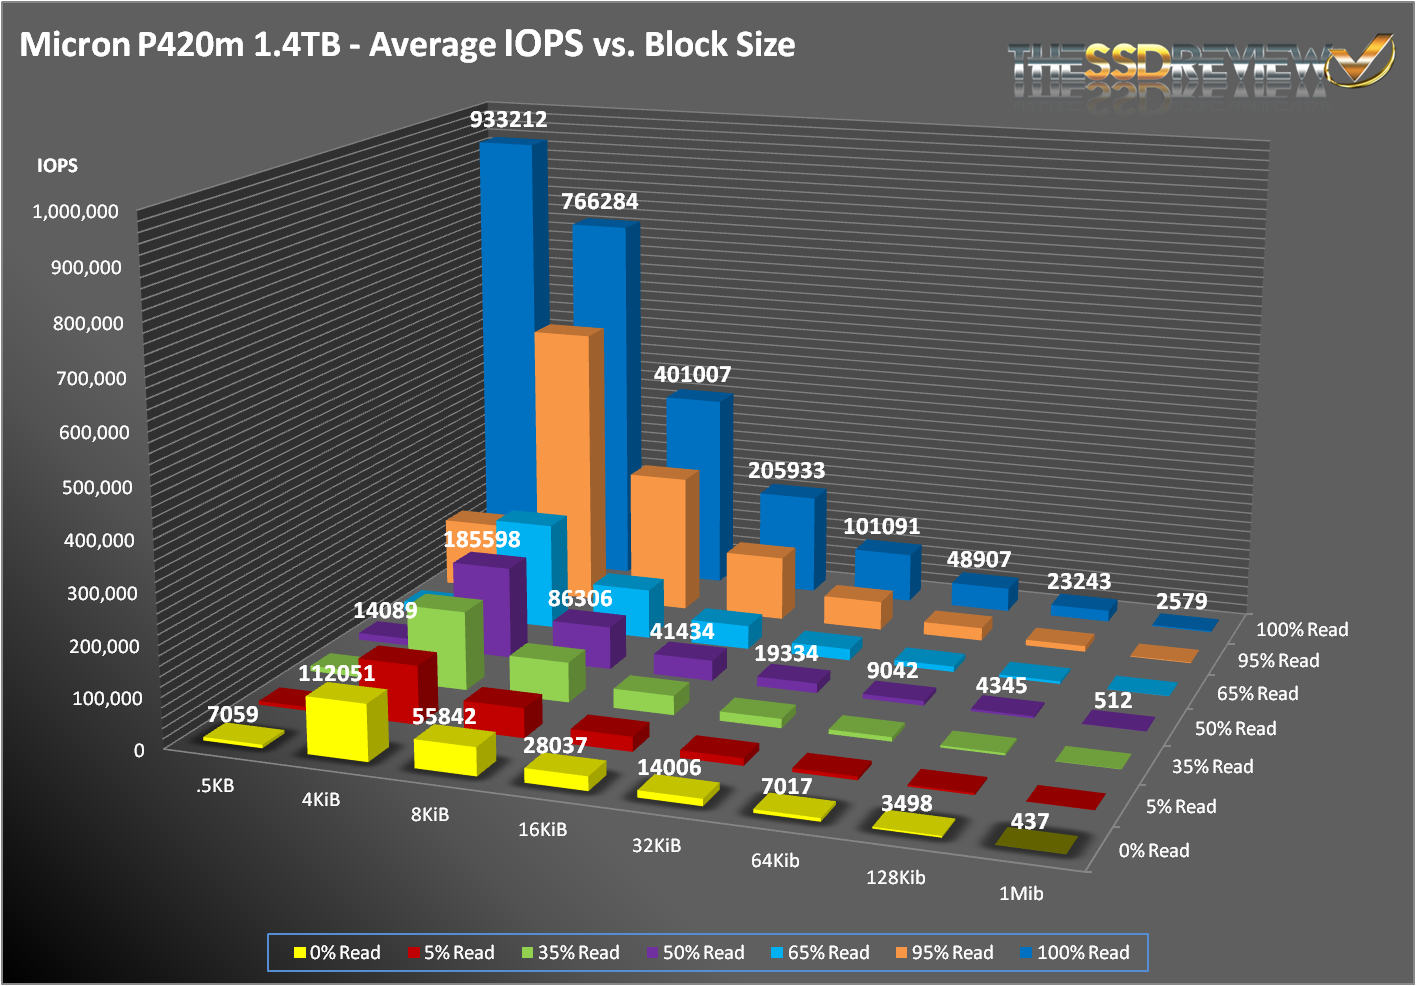
As you can see, we easily reached the specification for 4KB operations. In fact, all of the read-heavy tests scaled quite nicely. When you compare the graphs from both queue depths, you can see how much more heavily queue depth plays a factor in read performance, versus write performance.
If you remember back to our latency tests, the write performance for 512 byte operations was not very good. Our SNIA tests were no different. In fact, looking across all of the 512 byte access patterns, you see two drastically different results. On the write end, we could only muster 7K IOPS, which is really low. But, on the read end, we hit over 900K IOPS, which is really impressive, but not quite enough to top the 1.4M IOPS that the P320h posted.
Great review. Did you know tweaktown got Sandisk’s A110 PCIe SSD to review?
Yes…as well as Tom’s. It sometimes works like that and, if you stay tuned, you may see an exclusive M.2 report in the near future that we were lucky to grab.
page four, blue graph at the bottom (4K Read Steady State, 1 Hr at QD256) shows “LATENCY (ms)” in the left vertical axis name with values from 700.000 to 800.000.
Obviously it’s NOT latency, but it is IOPS which is really fantastic result. The sentence right below the graph clearly says this, I just wanted to point out as I know Les reads these comments and I’m pretty sure he will correct the graph very quickly.
And for sure, target audience knows to separate apples from oranges so it’s really obvious for us. Not too much average Joes are going to buy 1.4TB PCIe drive for three thousands to speed up loading of Windows 7 or Near Cry or whatever the game name is 🙂
Thank you for pointing that out! Will get to it.
How do you make this nice charts ?
Does it support NVMe?
this drive does not report TRIM support 🙁