
MEASURING PERFORMANCE
As with all of our tests, the following tests were performed after a secure erase of the drive. The drive was also conditioned with a predefined workload until it reached steady state. We also test across the entire span of the drive.
This is where we are going to start comparing the P420m to our SSD800MM 12Gbps SAS drives to see how they compare. Since we only had an 12Gbps HBA at our disposal, we treated the HGST drives as individual devices and manually separated the outstanding I/Os to each drive in IOMeter. Because of this, you will see lower small queue depth performance. Since these are enterprise drives, they will rarely encounter queue depths of 1 or 2.
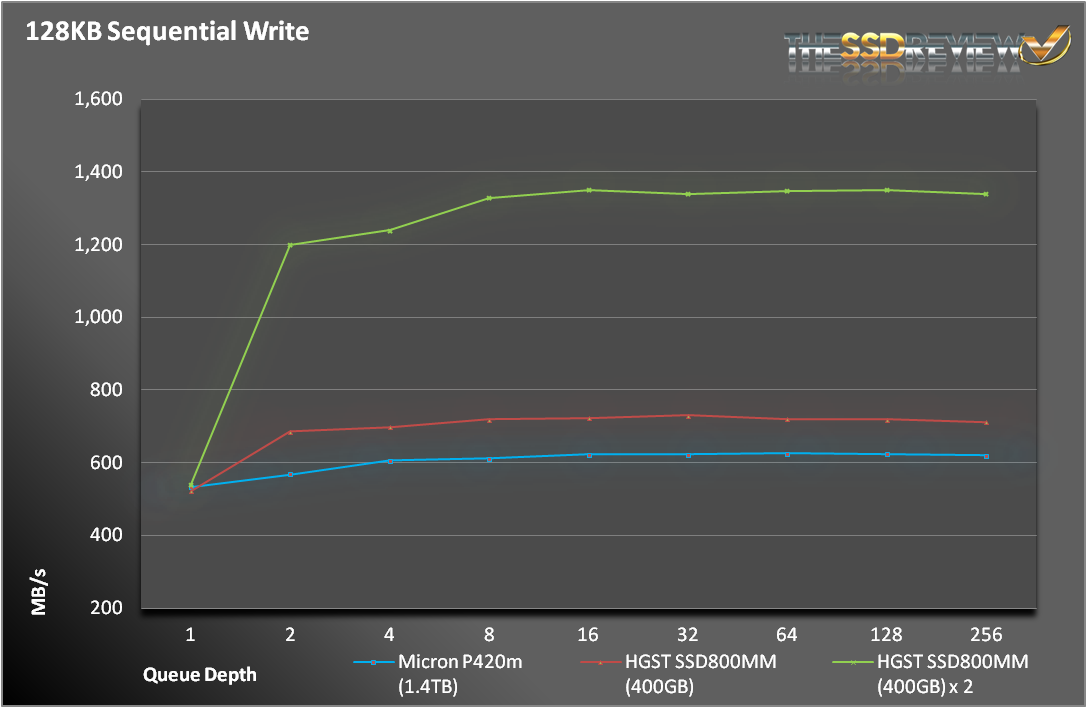
For sequential writes, it really isn’t much of a competition. Even a single HGST drive is enough to pass the P420m. With two drives, the SSD800MM puts the P420m in its place. This isn’t much of a surprise considering the P420m is focused on reads, where the HGST setup is more of an all-around performer.
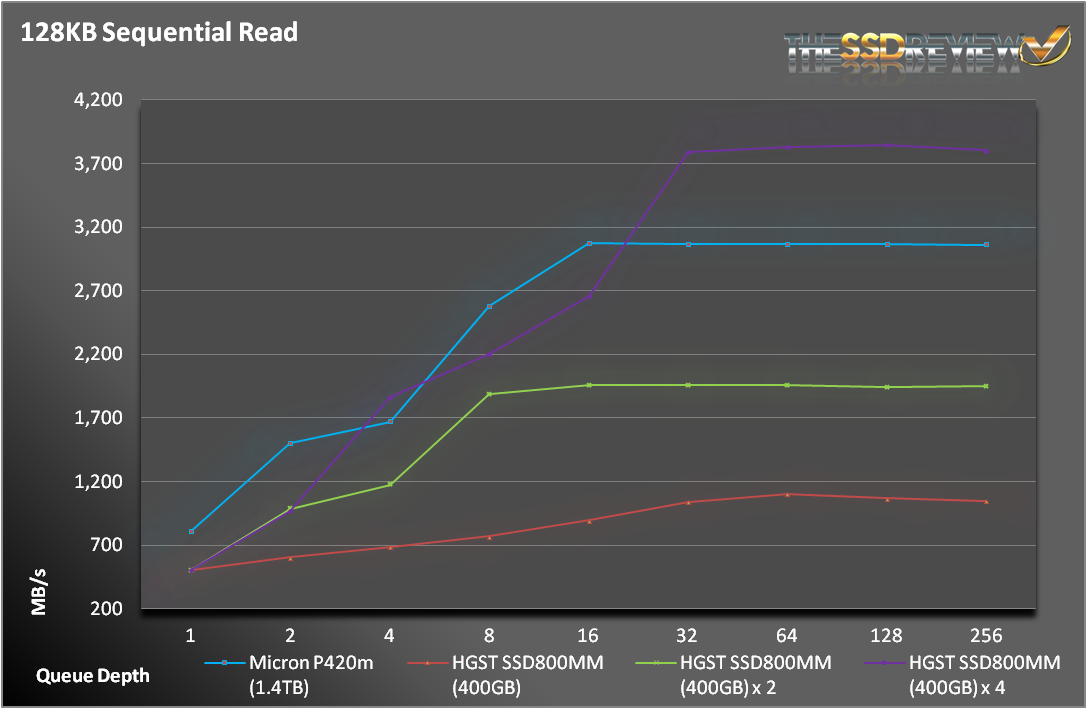
The P420m fairs much better with read operations, as it should. It took 4 SSD800MM drives to pass the 3GB/s that we got from our P420m. As we stated previously, using 2 HGST drives gives us a worse value proposition than the P420m. So, needing 4 of them to pass the P420m shows the value of the Micron drive.
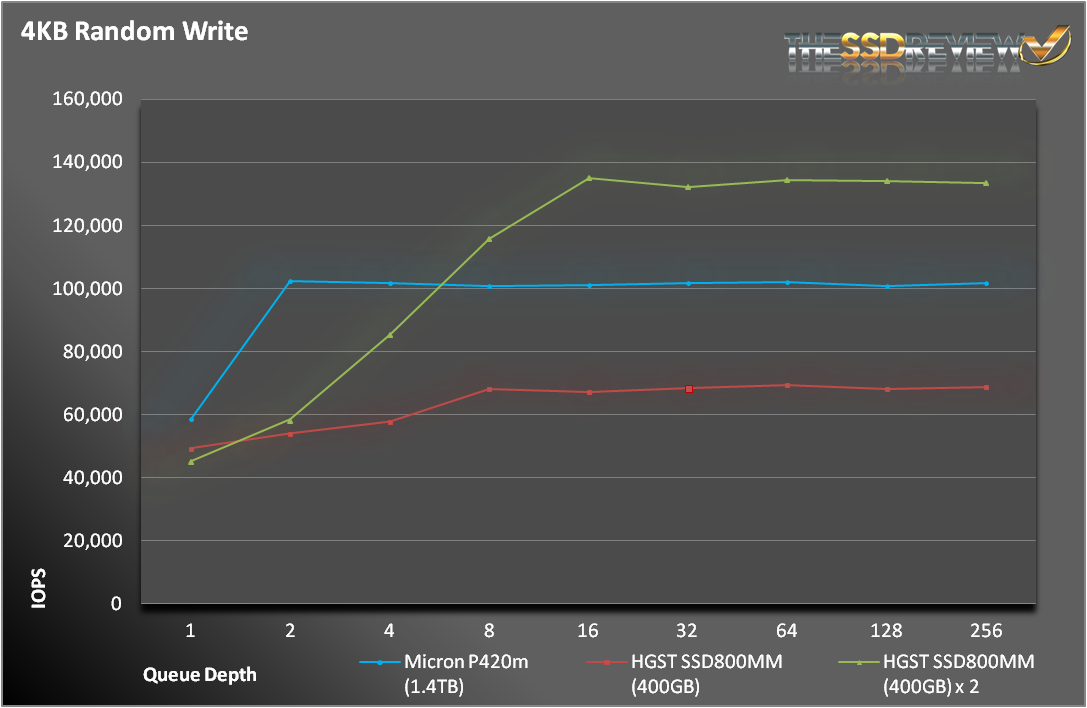
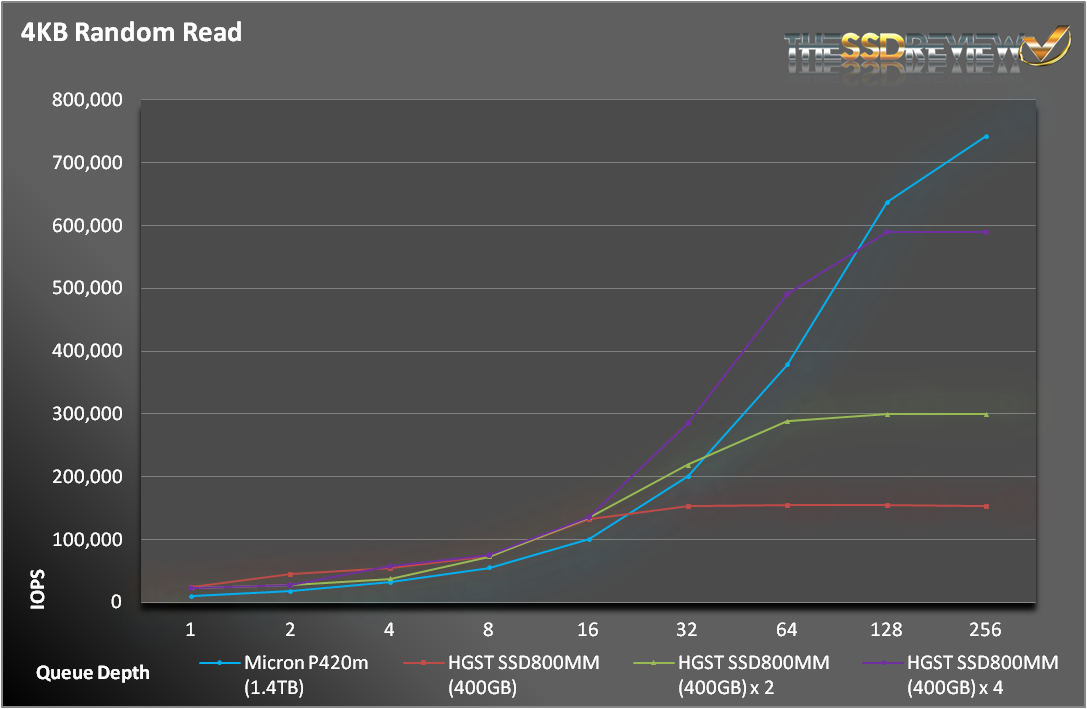
In our 4KB random tests, the P420m performs even better, in comparison. For 4KB writes, it takes 2 HGST drives to surpass the P420m, instead of 1. On the read side, not even 4 SSD800MMs were enough to knock the P420m off its perch. Hitting 760K IOPS in our read tests was amazing.
Micron was able to take the great read performance of the P320h and put it into the lower cost P420h. Unfortunately, the write performance didn’t carry over, but that isn’t the point of this drive. Micron is very clear about its target markets, so if you need more write performance, this may not be the drive for you.
Great review. Did you know tweaktown got Sandisk’s A110 PCIe SSD to review?
Yes…as well as Tom’s. It sometimes works like that and, if you stay tuned, you may see an exclusive M.2 report in the near future that we were lucky to grab.
page four, blue graph at the bottom (4K Read Steady State, 1 Hr at QD256) shows “LATENCY (ms)” in the left vertical axis name with values from 700.000 to 800.000.
Obviously it’s NOT latency, but it is IOPS which is really fantastic result. The sentence right below the graph clearly says this, I just wanted to point out as I know Les reads these comments and I’m pretty sure he will correct the graph very quickly.
And for sure, target audience knows to separate apples from oranges so it’s really obvious for us. Not too much average Joes are going to buy 1.4TB PCIe drive for three thousands to speed up loading of Windows 7 or Near Cry or whatever the game name is 🙂
Thank you for pointing that out! Will get to it.
How do you make this nice charts ?
Does it support NVMe?
this drive does not report TRIM support 🙁