TSSDR TEST BENCH AND PROTOCOL
SSD testing at TSSDR differs slightly, depending on whether we are looking at consumer or enterprise storage media. For our G-Technology Encrypted NVMe SSD testing today, our goal is to test in a system that has been optimized with our SSD Optimization Guide. To see the best performance possible, the CPU C states have been disabled, C1E support has been disabled, and Enhanced Intel SpeedStep Technology (EIST) has been disabled.
SYSTEM COMPONENTS
The components of this Test Bench are detailed below. All hardware is linked for purchase and product sales may be reached by a simple click on the individual item. As well, the title is linked back to the individual build article where performance testing can be validated.
TSSDR ASROCK Z370 TAICHI TEST BENCH (link)
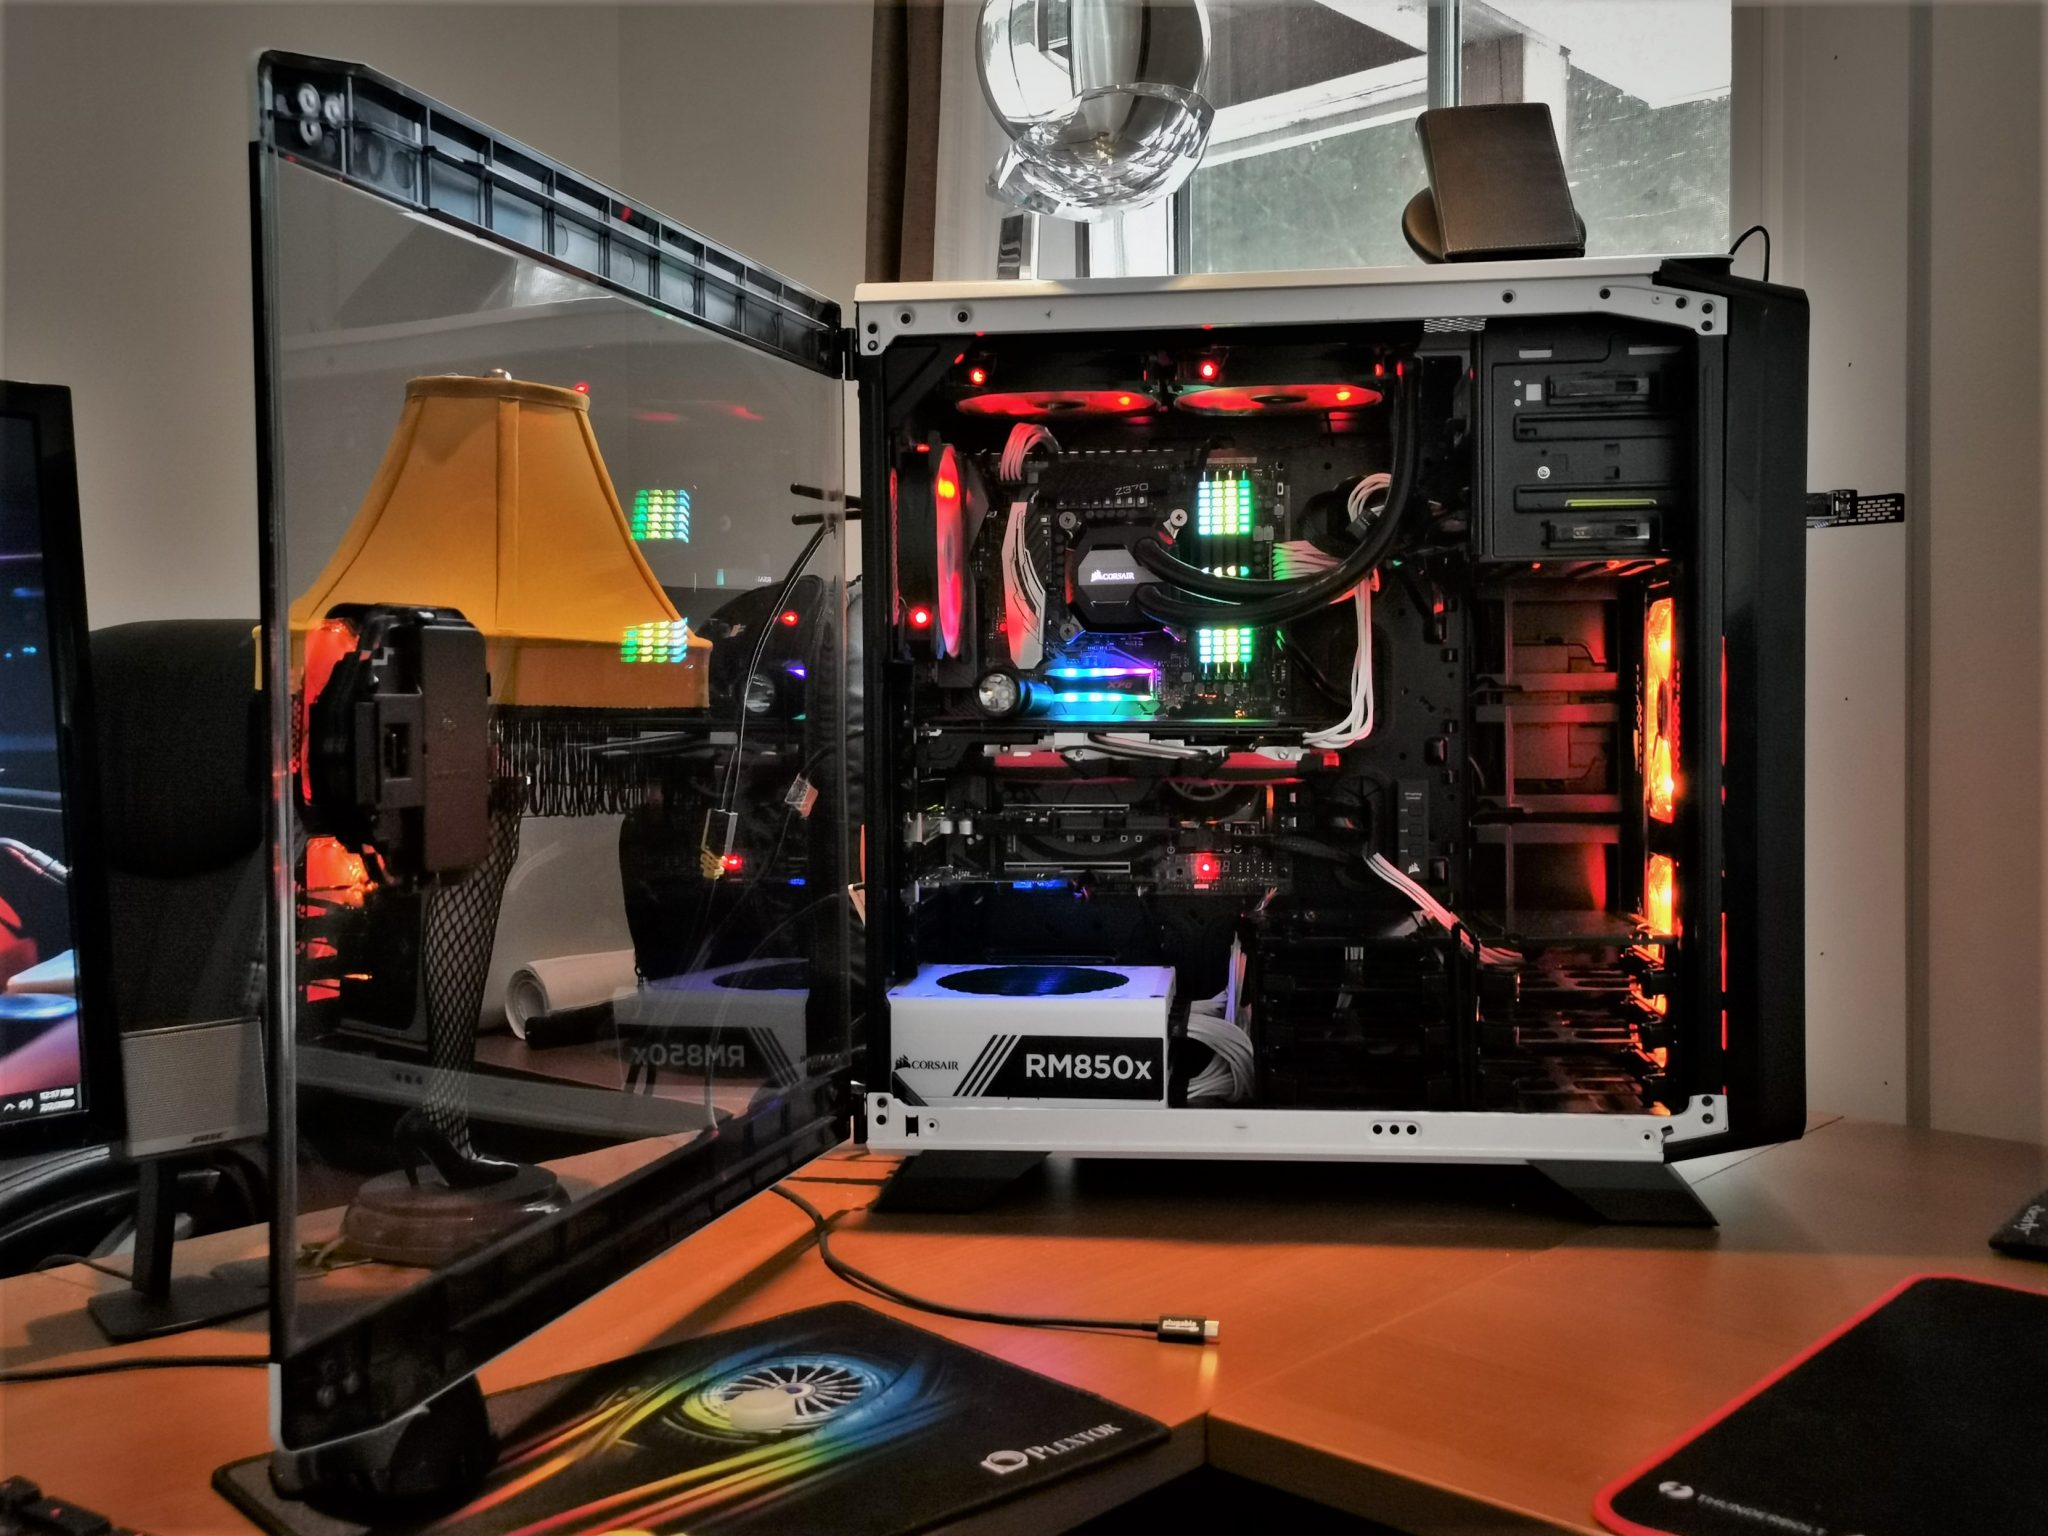
| PC CHASSIS: | Corsair Graphite 760T Arctic White Window Chassis |
| MOTHERBOARD: | ASRock Z370 Taichi |
| CPU: | Intel Coffee Lake Core i7-8770K |
| CPU COOLER: | Corsair Hydro Series H110i GTX |
| POWER SUPPLY: | Corsair RM850x 80Plus |
| GRAPHICS: | MSI Radeon RX570 |
| MEMORY: | Corsair Vengeance RGB 32GB DDR4 3600Mhz C18 |
| STORAGE: | Intel Optane 900P 480GB SSD |
| KEYBOARD: | Corsair Strafe RGB Silent Gaming |
| MOUSE: | Corsair M65 Pro Gaming |
| OS | Microsoft Windows 10 Pro 64 Bit |
BENCHMARK SOFTWARE
The software in use for today’s analysis is typical of many of our reviews and consists of Crystal Disk Info, ATTO Disk Benchmark, Crystal Disk Mark, AS SSD, Anvil’s Storage Utilities and AJA, . Our selection of software allows each to build on the last and to provide validation to results already obtained.
ATTO Disk Benchmark is perhaps one of the oldest benchmarks going and is definitely the main staple for manufacturer performance specifications. ATTO uses RAW or compressible data and, for our benchmarks, we use a set length of 256mb and test both the read and write performance of various transfer sizes ranging from 0.5 to 8192kb. Manufacturers prefer this method of testing as it deals with raw (compressible) data rather than random (includes incompressible data) which, although more realistic, results in lower performance results.
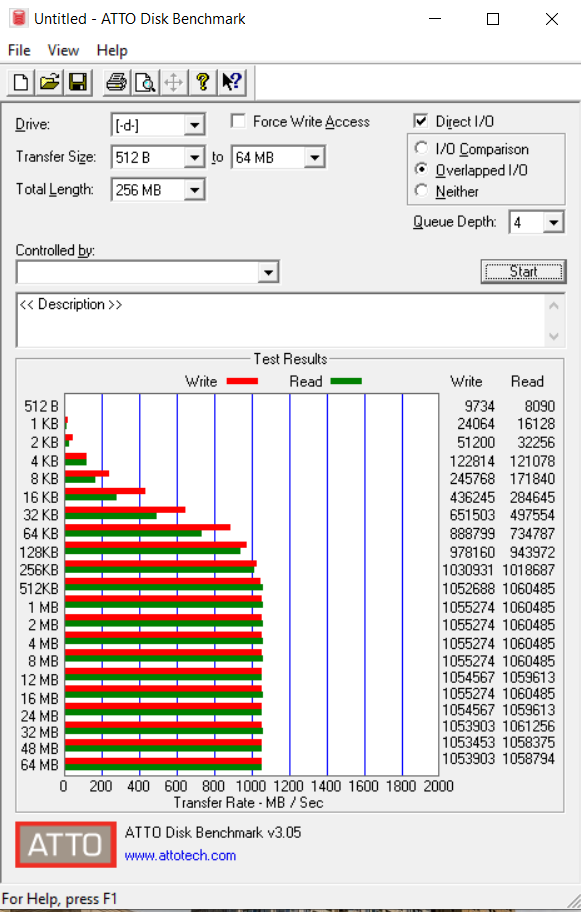
These are excellent results that demonstrate a steady and gradual increase commensurate with data file sample size, and they also hit listed specs dead on.
CRYSTAL DISK BENCHMARK VER. 7.0.0 x64
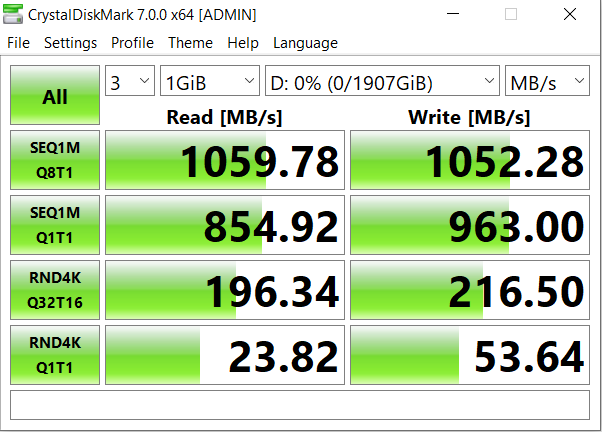
Crystal Disk Benchmark is used to measure read and write performance through sampling of random data which is, for the most part, incompressible. Performance is virtually identical, regardless of data sample so we have included only that using random data samples.
THROUGHPUT
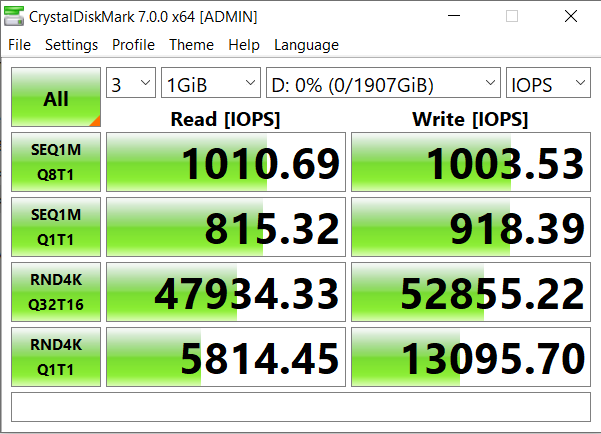
IOPS