
TEST SETUP AND METHODOLOGY
In testing all enterprise drives we focus on long-term stability. In doing so, we stress products not only to their maximum rates, but also with workloads suited to enterprise environments. We use many off-the-shelf tests to determine performance, but we also have specialized tests to explore specific behaviors we encounter. With enterprise drives, you will see that we do not focus on many consumer-level use-cases.
When testing SSDs, the drive is purged and then preconditioned into a steady state before capturing its performance results. We also disable all write caching on the DUT when possible, this ensures consistent results that are compliant with SNIA standards. Our hope is that we present tangible results that provide relevant information to the buying public.
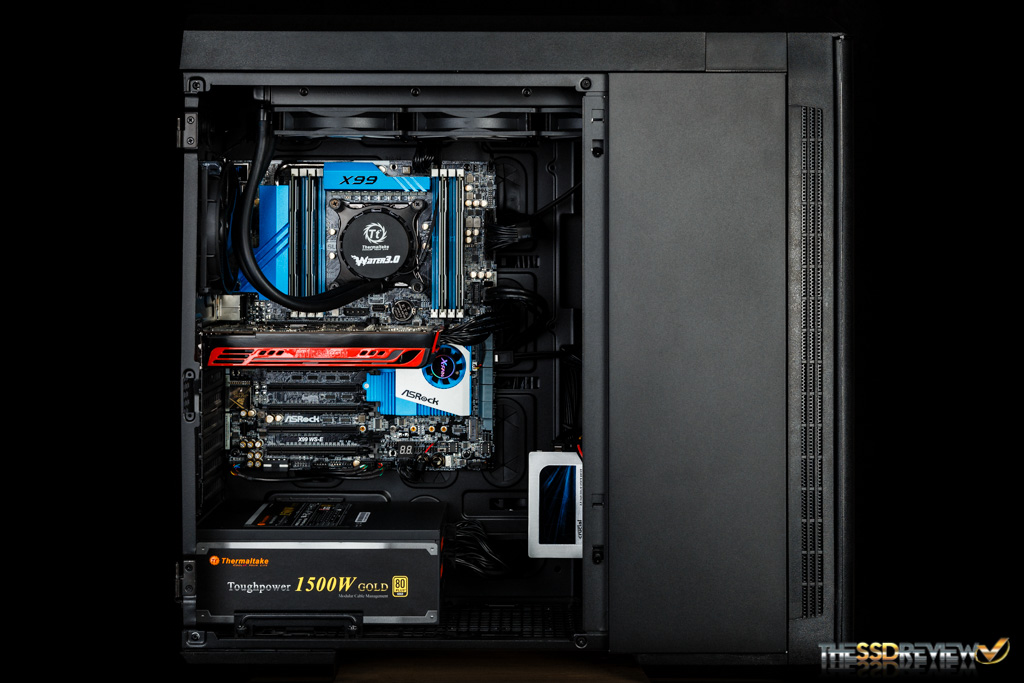
SYSTEM COMPONENTS
| PC CHASSIS: | Thermaltake Urban T81 |
| MOTHERBOARD: | ASRock X99 WS-E |
| CPU: | Intel Xeon E5-2690 v3 |
| CPU COOLER: | Thermaltake Water 3.0 Ultimate |
| POWER SUPPLY: | Thermaltake Toughpower 1500W Gold |
| GRAPHICS: | MSI GT 720 |
| SYSTEM COOLING: | be quiet! Silent Wings 2 |
| MEMORY: | Kingston ValueRAM DDR4 2400MHz ECC 64GB |
| STORAGE: | Crucial MX200 500GB |
| OS: | Windows Server 2012 R2 |
| MOBO FIRMWARE: | 1.70 |
This Test Bench build was the result of some great relationships and purchase; our appreciation goes to those who jumped in specifically to help the cause. Key contributors to this build are our friends at ASRock for the motherboard and CPU, be quiet! for the cooling fans, and Thermaltake for the case. We have detailed all components in the table below and they are all linked should you wish to make a duplicate of our system as so many seem to do, or check out the price of any single component. As always, we appreciate your support in any purchase through our links!
SNIA TESTING
The Storage Networking Industry Association has an entire industry accepted performance test specification for solid state storage devices. Some of the tests are complicated to perform, but they allow us to look at some important performance metrics in a standard, objective way.
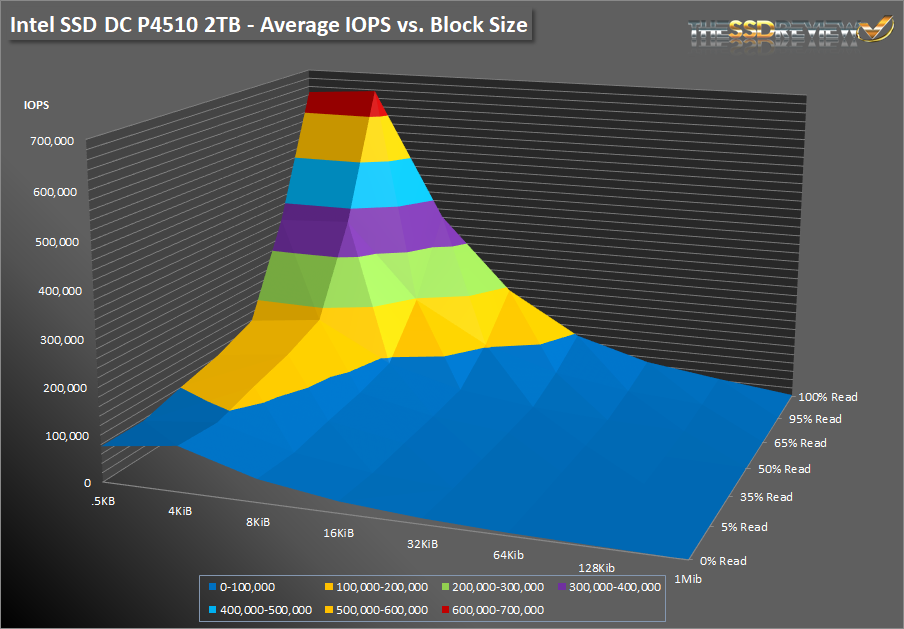
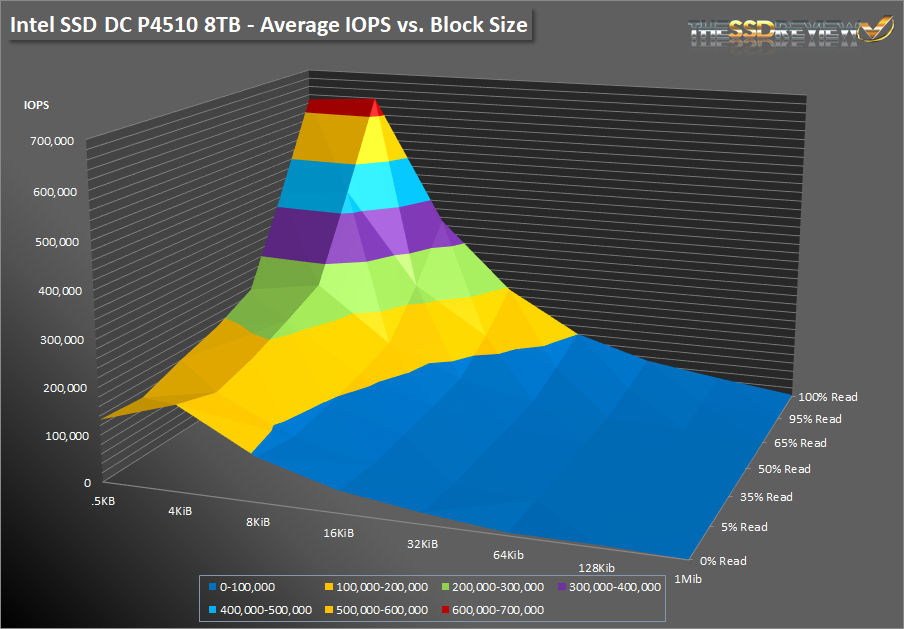
SNIA’s Performance Test Specification (PTS) includes IOPS testing, but it is much more comprehensive than just running 4KB writes with Iometer. SNIA testing is more like a marathon than a sprint. In total, there are 25 rounds of tests, each lasting 56 minutes. Each round consists of 8 different block sizes (512 bytes through 1MB) and 7 different access patterns (100% reads to 100% writes). After 25 rounds are finished (just a bit longer than 23 hours), we record the average performance of 4 rounds after we enter steady state.
- Purge: Secure Erase, Format Unit, or vender specific
- Preconditioning: 2x capacity fill with 128K sequential writes
- Each round is composed of .5K, 4K, 8K, 16K, 32K, 64K, 128K, and 1MB accesses
- Each access size is run at 100%, 95%, 65%, 50%, 35%, 5%, and 0% Read/Write Mixes, each for one minute.
- The test is composed of 25 rounds (one round takes 56 minutes, 25 rounds = 1,400 minutes)
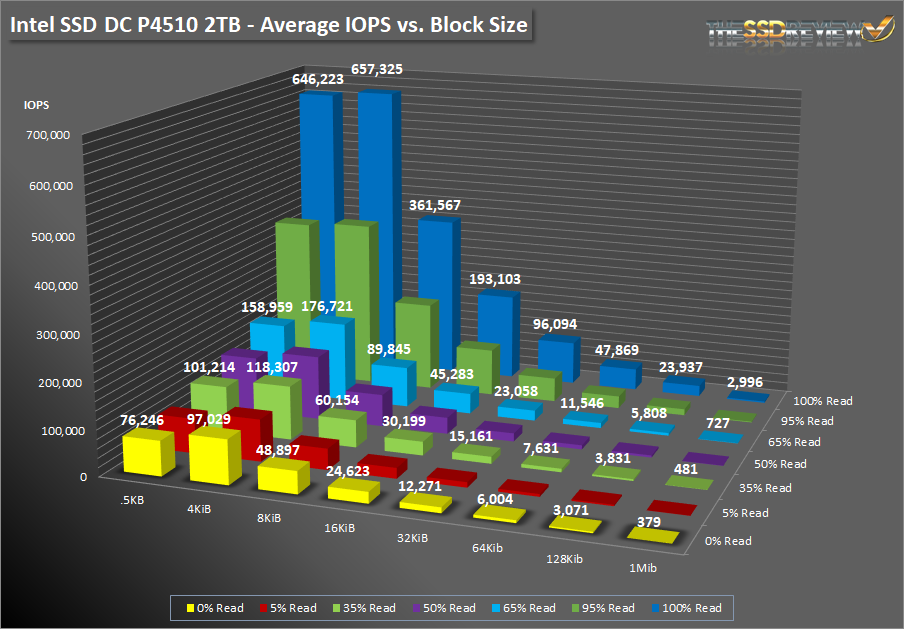
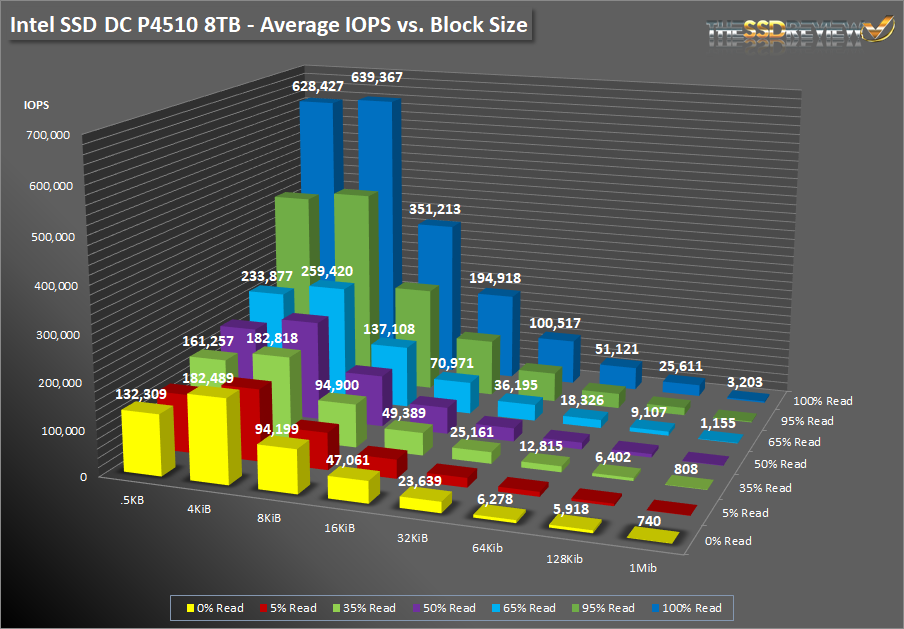
Unlike some of our other performance tests, the SNIA tests only last for a relatively short period of time each (1 minute), but they cover many more access patterns and transfer sizes to give us a good picture of the SSD’s performance. All tests were done at a QD of 256. As the results show, the 2TB Intel DC P4510 delivered over 657K IOPS at 100% 4K read and 97K IOPS during 100% write. The 8TB model topped out at 639K IOPS read and doubled the 2TB model’s write performance by delivering an impressive 182K IOPS write. The mixed performance looks to be very good with strong results in the 65% read to 100% read workloads. The 8K and 16K results scale well here as well and results of 8K are half of 4K’s and 16K is half of that and so on.
LATENCY
To specifically measure latency, we use a series of 512b, 4K, and 8K measurements. At each block size, latency is measured for 100% read, 65% read/35% write, and 100% write/0% read mixes.
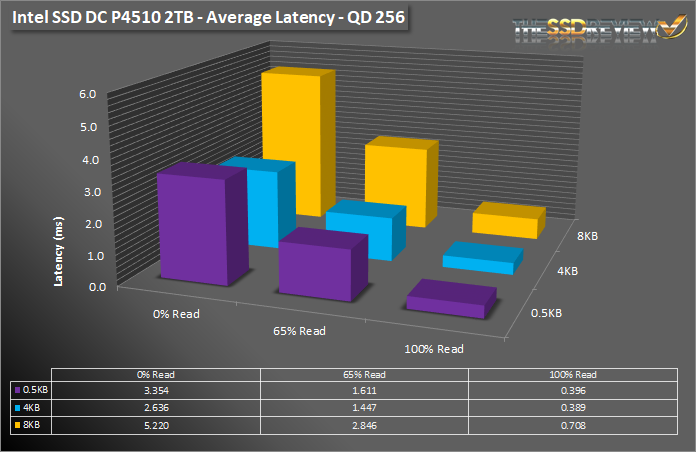
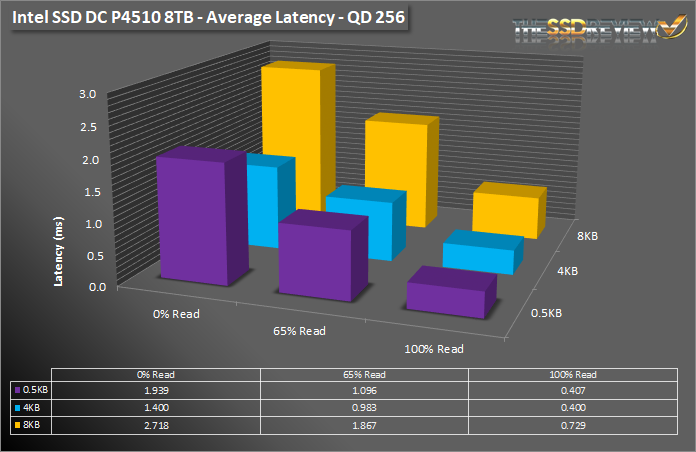
Latency results from this test are very respectable. Overall, they are close to what we saw from the HGST SN100. Average latency results are just slightly higher, but compared to the Intel DC P3520 1.2TB model we reviewed previously, it is night and day here.
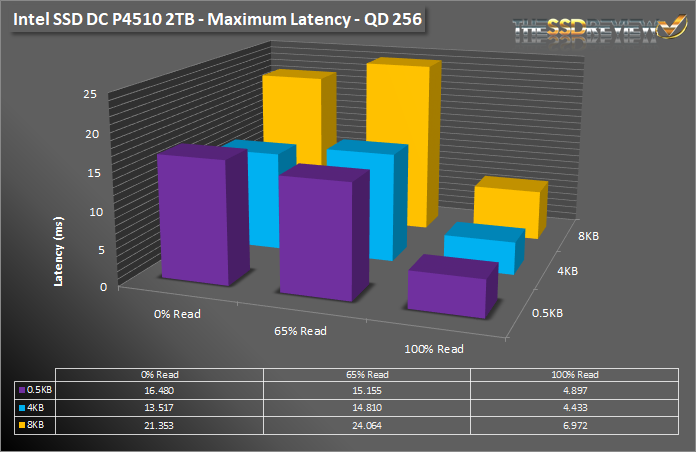
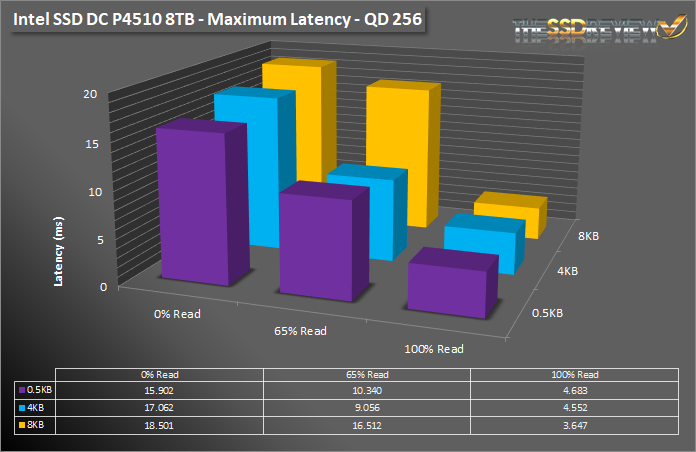
We can see that Intel has worked very hard on their latest NAND and firmware to deliver products with even better QoS than we’ve seen before. Similar to the average latency results, maximum latencies are also very respectable. With the highest latency spike being 24ms in the 65% 8K read workload. Very impressive so far.
Do you have access to, and are willing to review, the Intel SSD DC P4511 Series in 2TB and 4TB capacity?
I’m especially interested in their 4K Q1D1 random speeds.
No sorry. I don’t believe they have sampled that drive.
OK, thanks for letting me know.
Forgot to add the link to the Intel website : https://www.intel.com/content/www/us/en/products/compare-products.html/memory-storage?productIds=192995,137107,137112
are these drives good to use on a Mac?