
AJA VIDEO SYSTEM DISK TEST
The AJA Video Systems Disk Test is relatively new to our testing and tests the transfer speed of video files with different resolutions and Codec.

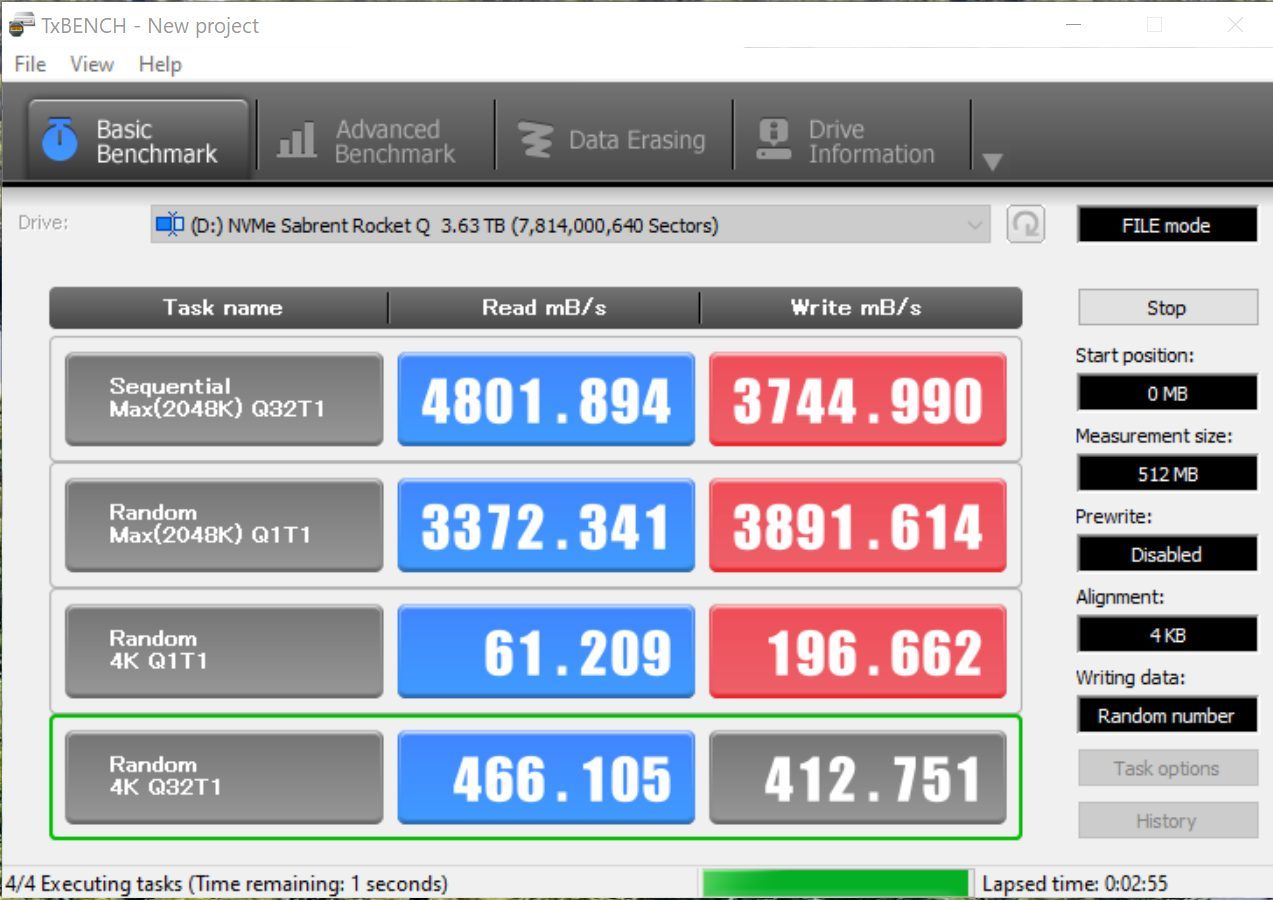
TxBench is one of our newly discovered benchmarks that we works much the same as Crystal Diskmark, but with several other features. Advanced load benchmarking can be configured, as well as full drive information and data erasing via secure erase, enhanced secure erase, TRIM and overwriting. Simply click on the title for a free copy.
The SSD Review uses PCMark 8’s Storage test suite to create testing scenarios that might be used in the typical user experience. With 10 traces recorded from Adobe Creative Suite, Microsoft Office and a selection of popular games, it covers some of the most popular light to heavy workloads. Unlike synthetic storage tests, the PCMark 8 Storage benchmark highlights real-world performance differences between storage devices. After an initial break-in cycle and three rounds of the testing, we are given a file score and bandwidth amount. The higher the score/bandwidth, the better the drive performs.
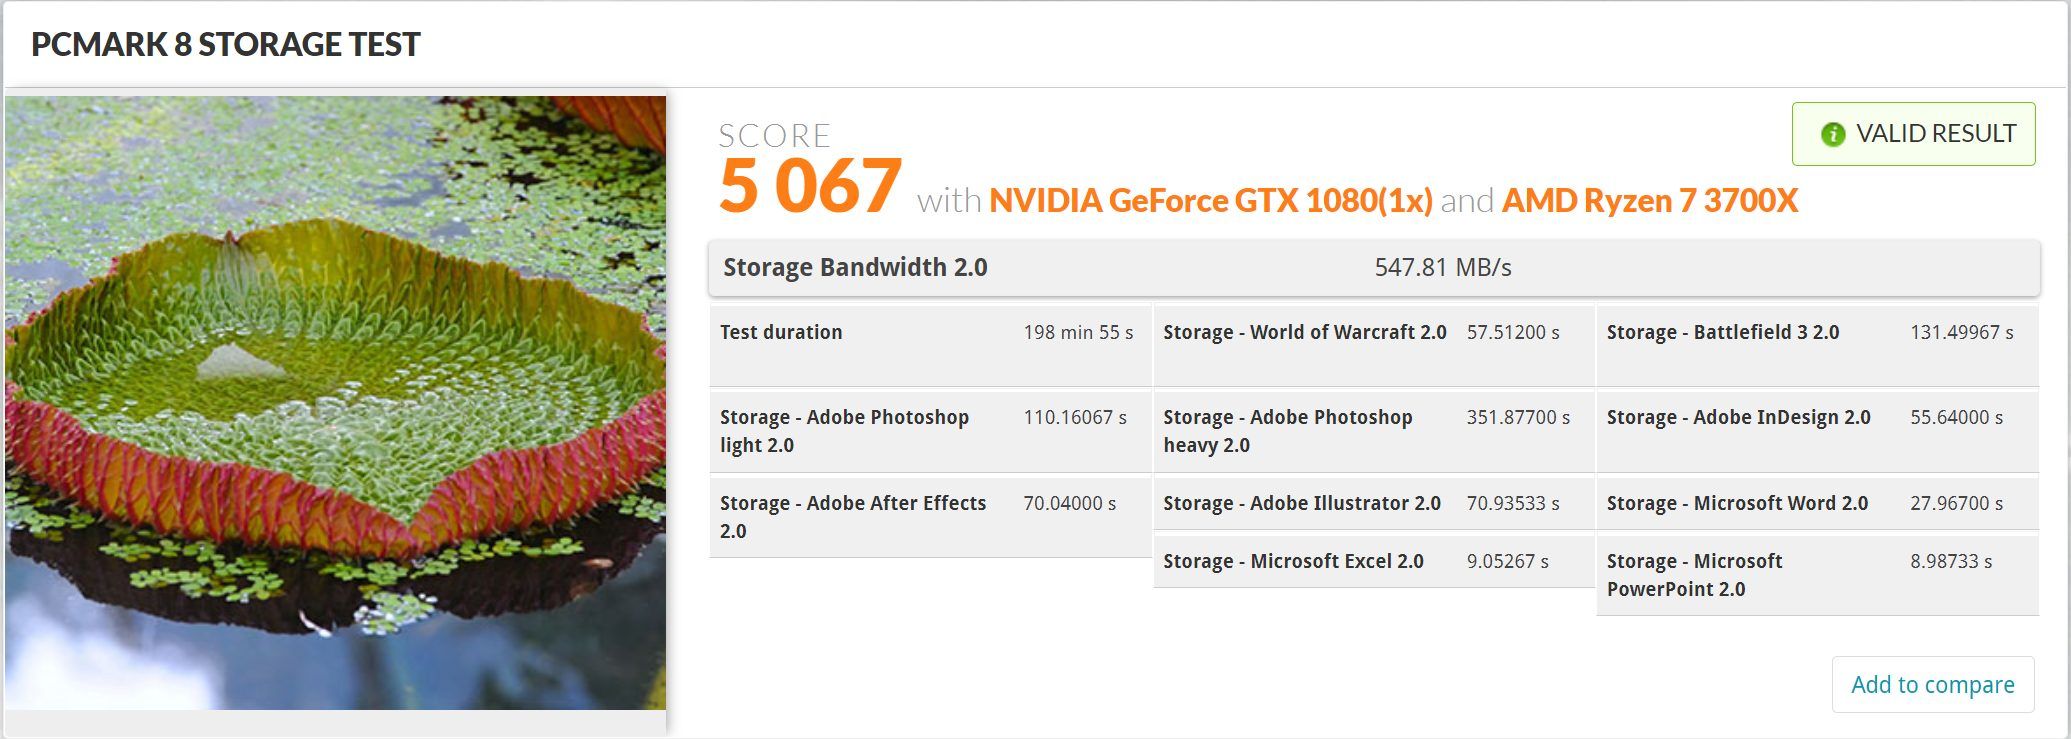
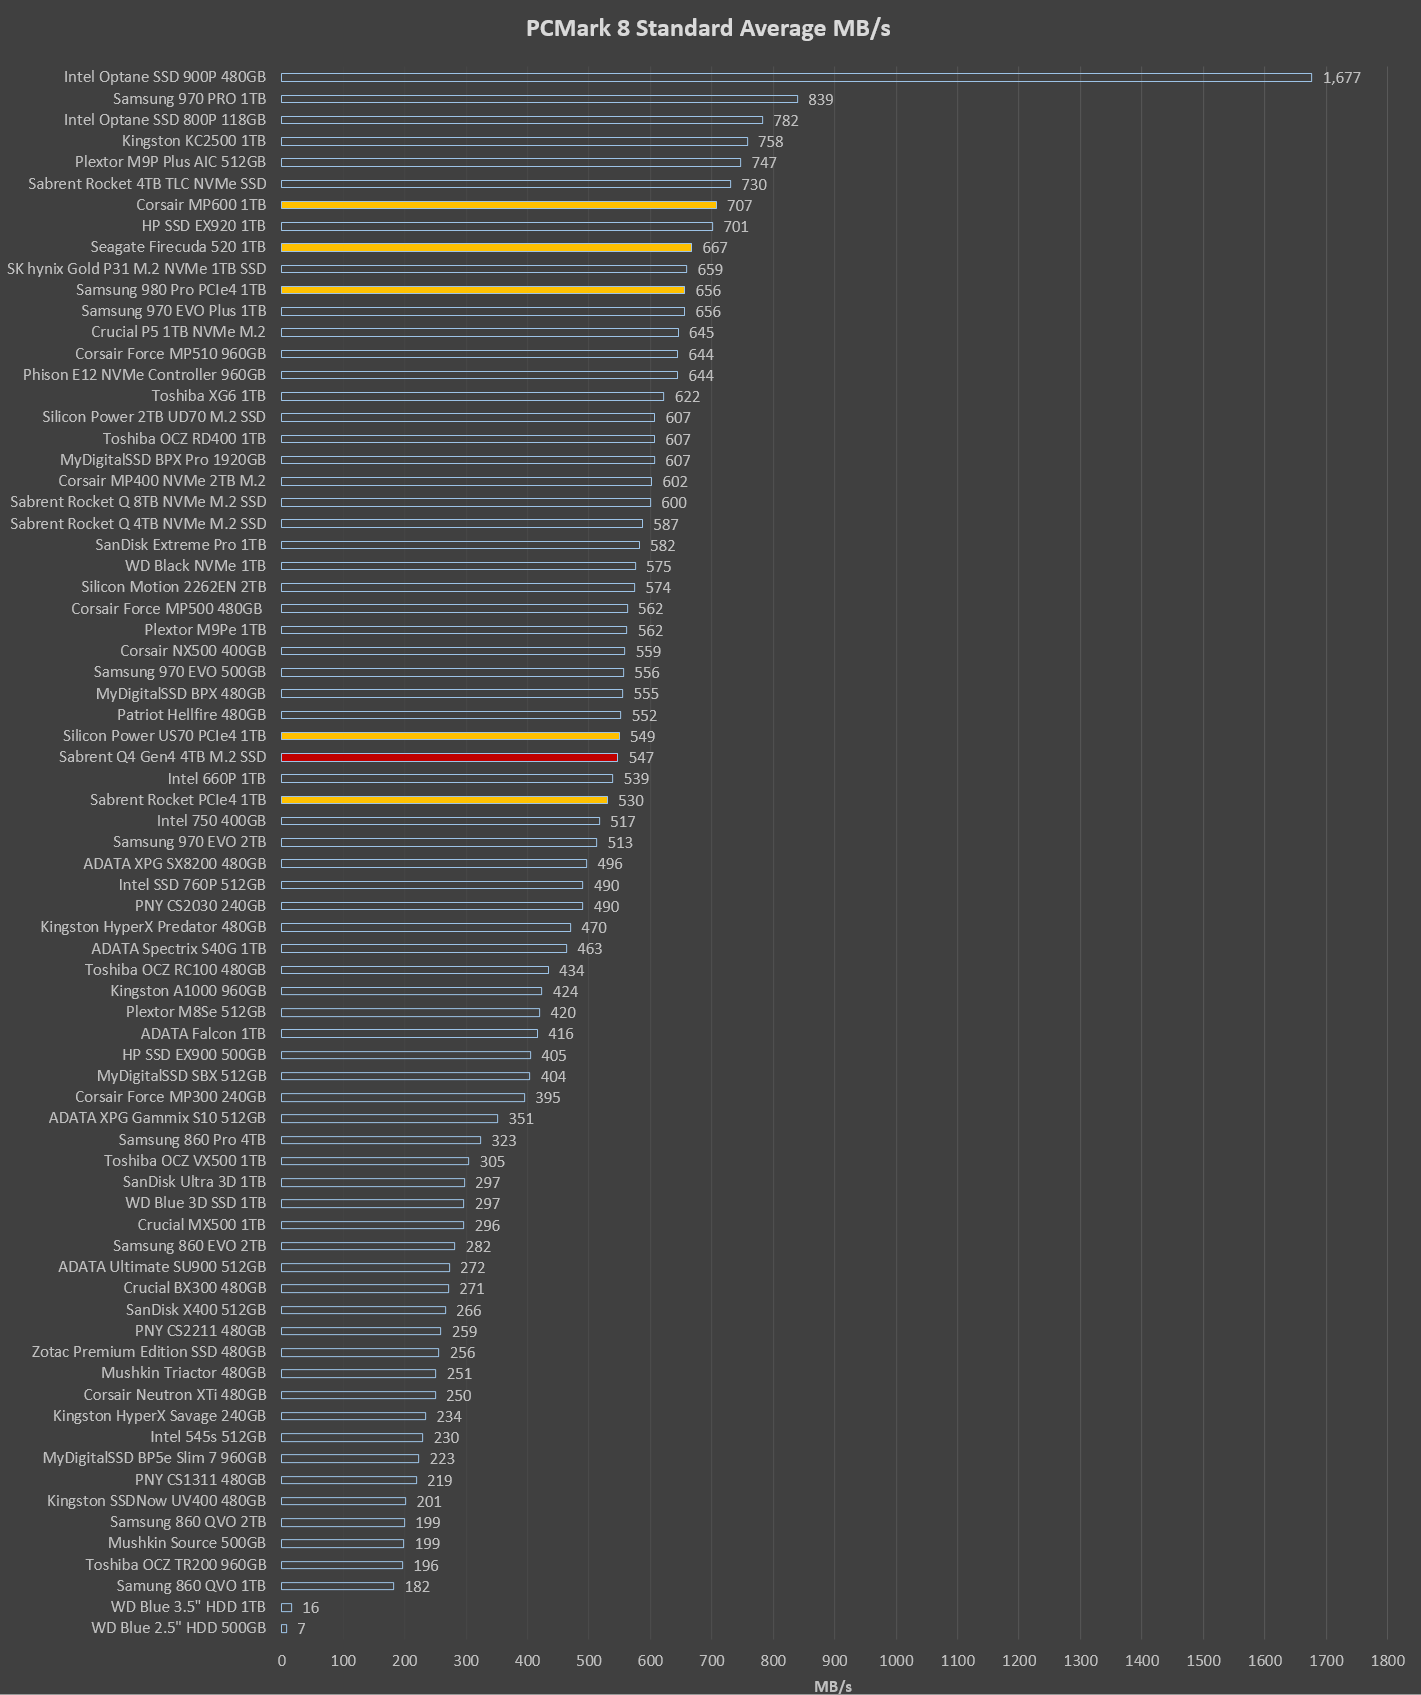
The Sabrent Rocket Q4 returned 547MB/s in its PCMark 8 Storage 2.0 testing which is somewhat low for what we might expect from a Gen 4 SSD. We have highlighted a few others for a basis of comparison.
Dear Les,
I think there is a typo in the last few sentences on the first page, were the per seconds part should not be there after the capacity in megabyte (gigabyte, after all?) “… 3725MB/s available for user storage once formatted …”
Is the difference related to the 1000 vs 1024 marketing thingy or simply to overprovisioning practices.
Also, while on topic of overprovisioning. I usually format and partition SSDs with Partition Guru. The way I do it is dividing the total capacity in bytes by the number of storage chips on the drive. Then I divide this by eight, so that I know how many 4K(=8 times 512 bytes) aligned sectors essentially there are. Then I size the very first part for EFI System Partition (ESP) to be large enough to contain the recommend 100 megabytes size. Whatever the amount in bytes, I subtract this from the result of the division, and create the first NTFS partition so that the sum of “the very first MBR sector + ESP + the first partition” is exactly, down to the byte, as large as a single chip can hold. To size the remaining partitions is simpler, as from that point on I only have to decide on exactly how many chips a given partition spans out over.
So, I usually get extremely, really down to the bytes precise results when examining the sector count boundaries afterwards. But on rare occasions I just brick the drive, simple as that …
And that made me wonder in trying to be this precise I inadvertedly wreak havoc in the overprovisioning proper, i.e. the way it is engineered on circuit logic level.
So, long story short, my question proper:
The overprovisioned part, say X percentage of a drive’s total capacity is …
a) an a single allocated and continuous area on one of the chips?
or
b) this X percentage is further divided by the number of chips, and each of them contains an equal sized OP area (the sum of which essentially being the X percentage in total)?
I do hope you can enligthen me 😉
Kind regards,
-Christian
Unfortunately, I cannot and thank you for replying. I don’t play with overprovisioning at all because…as you said… some drives brick. Typically, we want to test them to the extent that the reader can determine if it is the drive for them, and also so they can imitate same in their tests.