
TSSDR TEST BENCH AND PROTOCOL
SSD testing at TSSDR differs slightly, depending on whether we are looking at consumer or enterprise storage media. For our Sabrent 4TB Rocket Q4 Gen 4 M.2 SSD testing today, our goal is to test in a system that has been optimized and will reach top speeds possible.
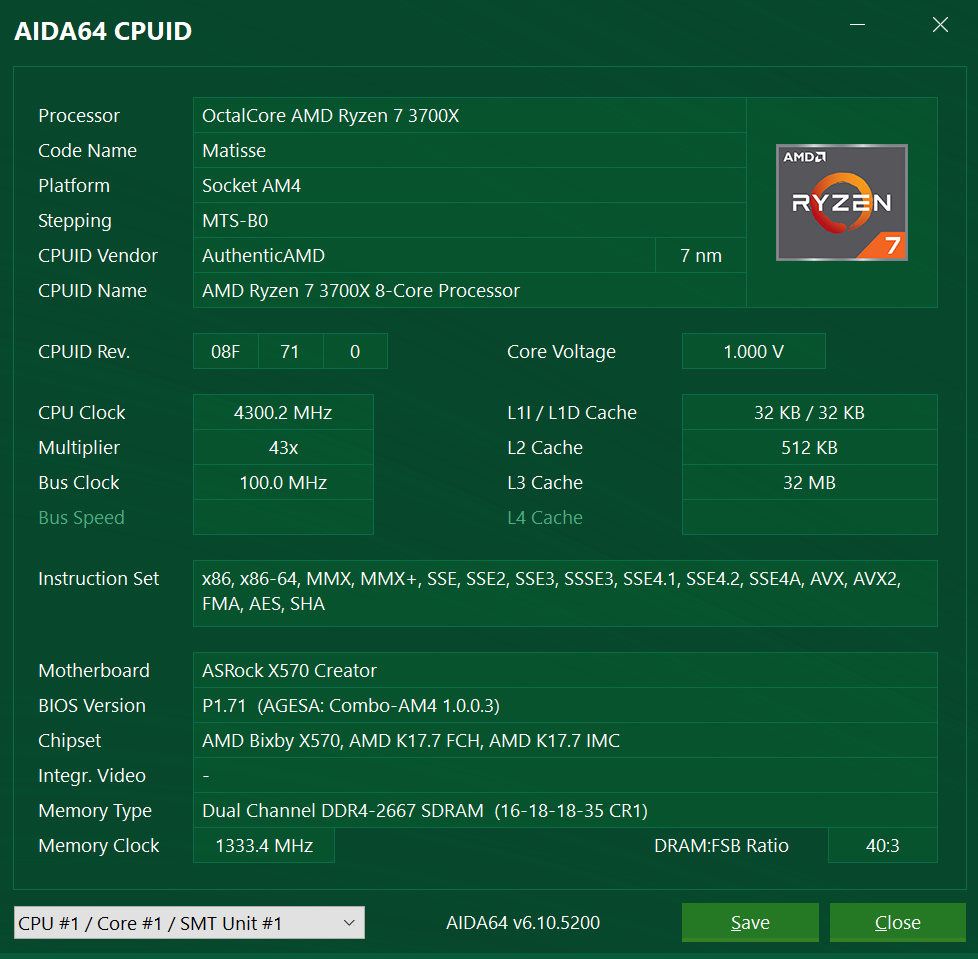
We are using a fairly new ASRock X570 Creator Test Bench which is AMD based and contains the AMD Ryzen 3700x Gen 4 CPU. Our PC has been overclocked from 3600Mhz to 4300MHz and memory has been set at a XMP profile of 2667MHz.
SYSTEM COMPONENTS
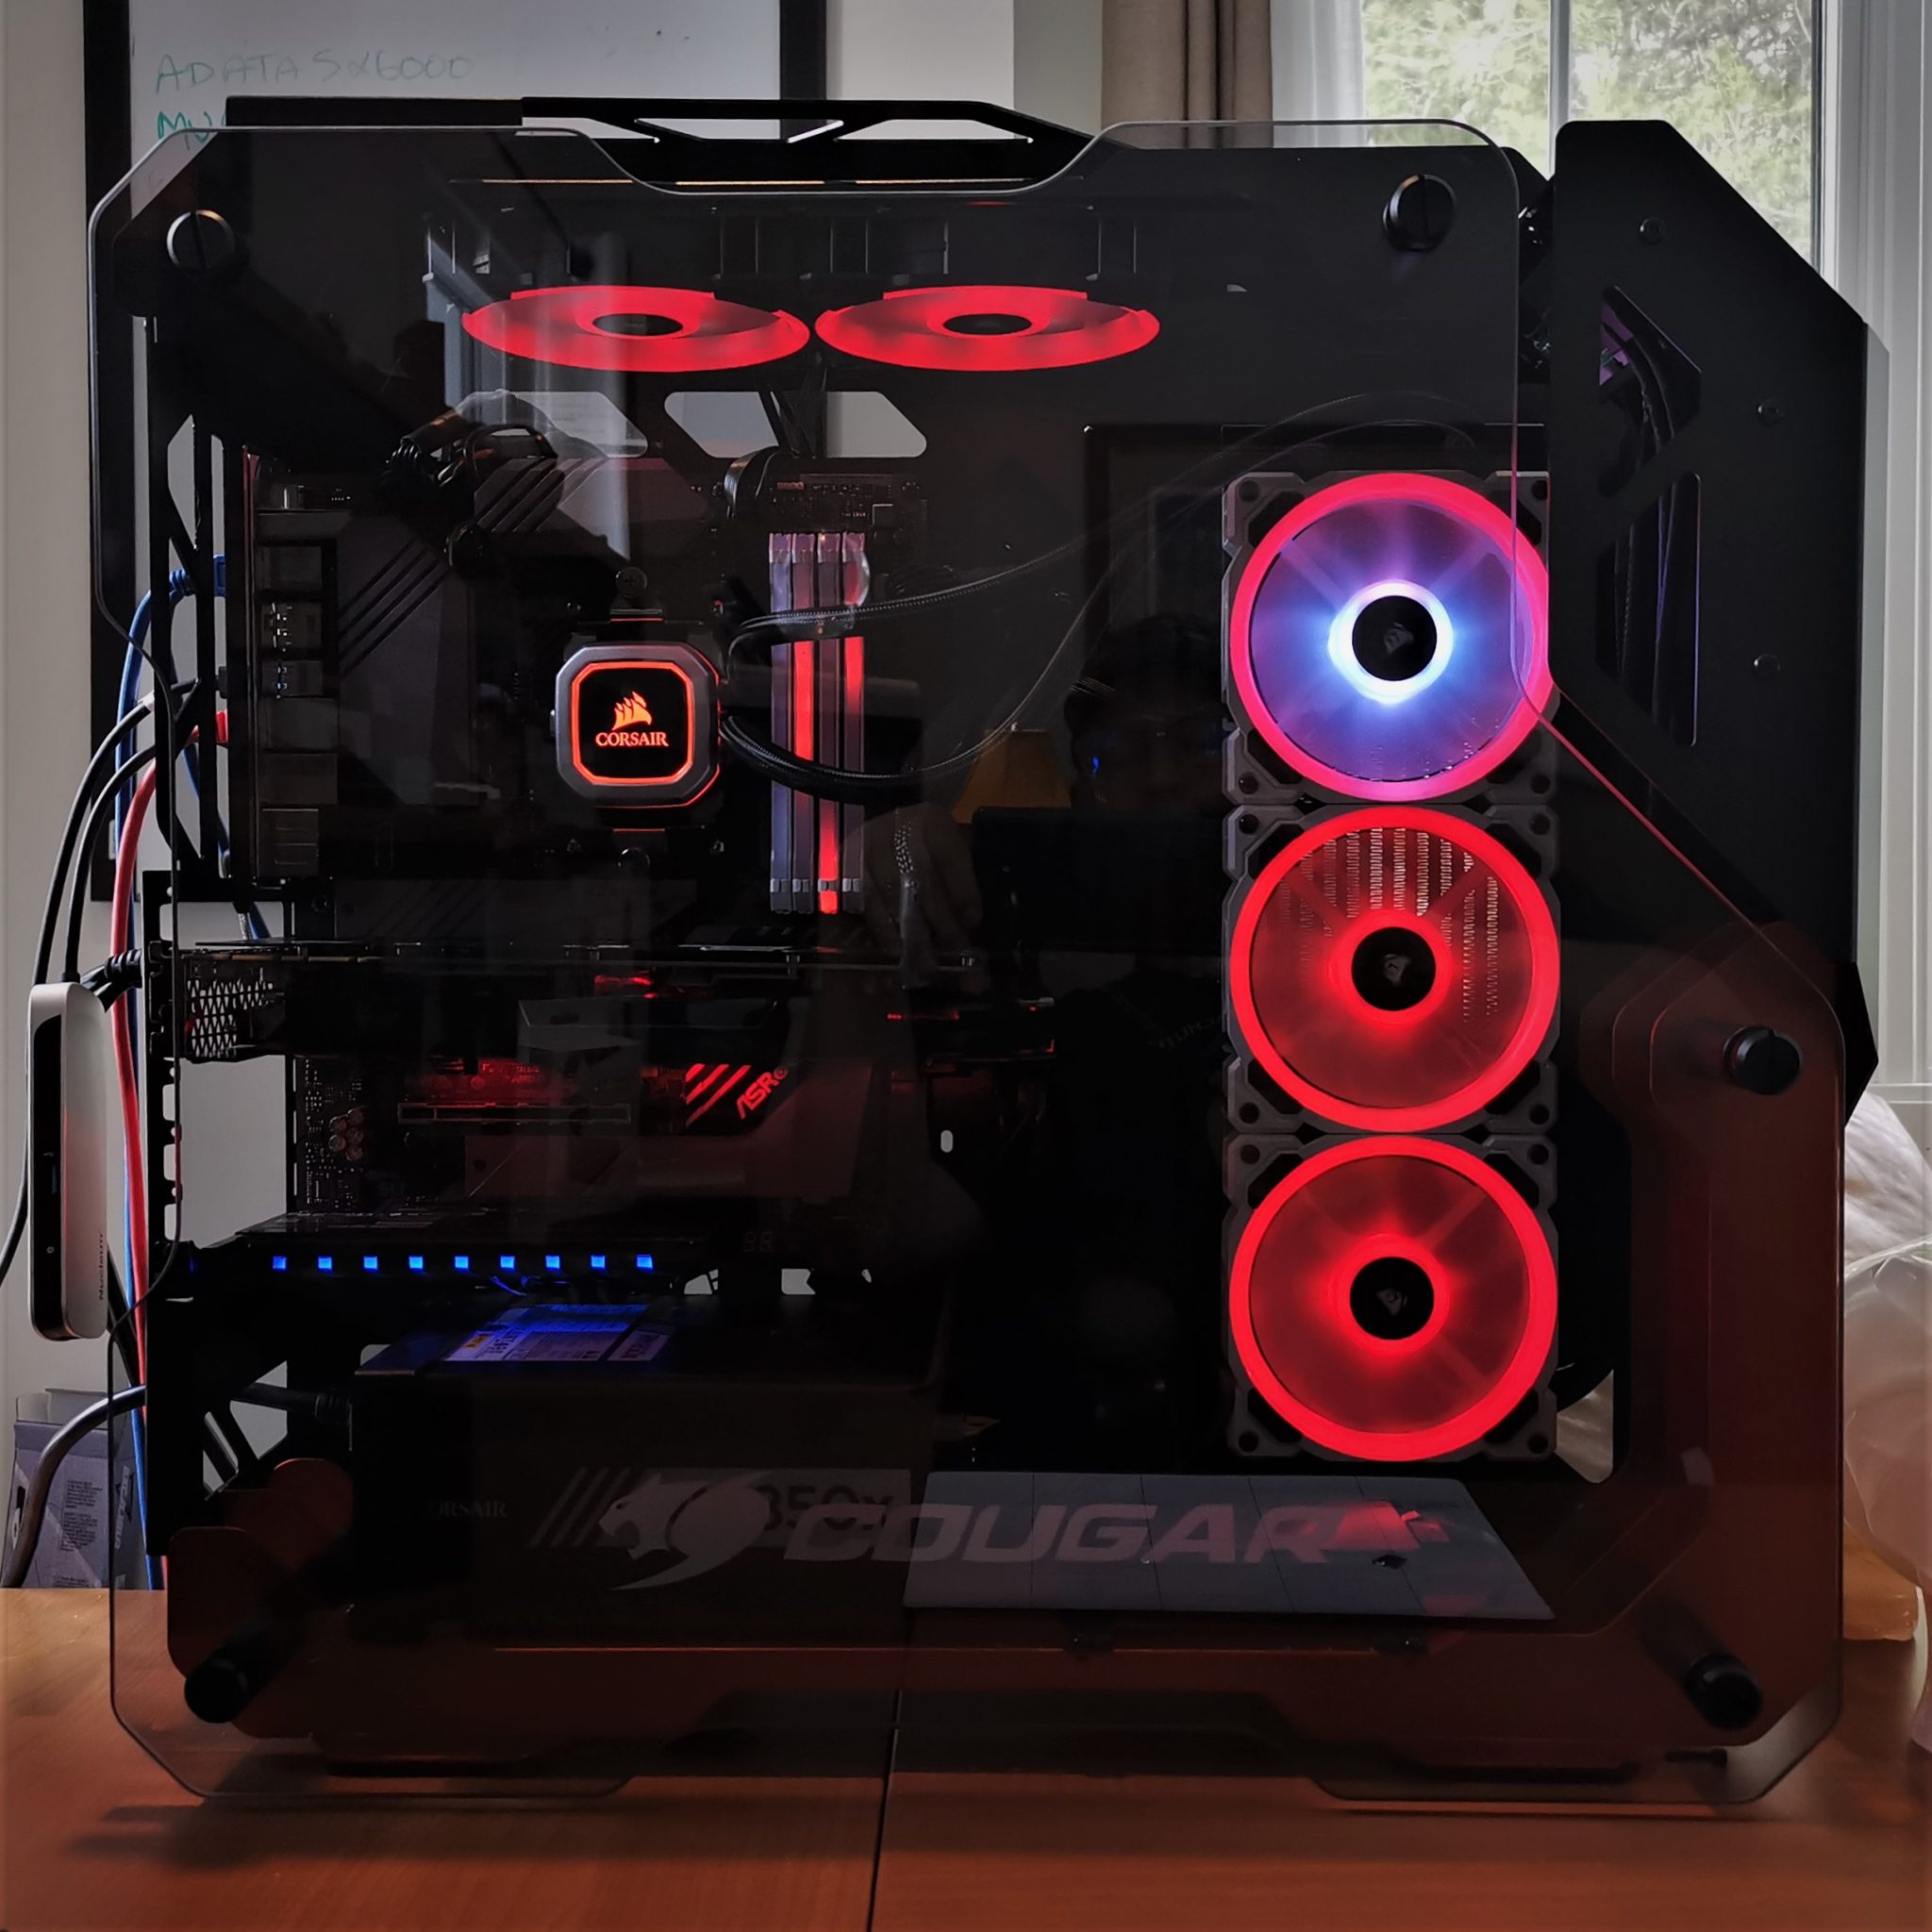
The components of this Test Bench are detailed below. All hardware is linked for purchase and product sales may be reached by a simple click on the individual item. As well, the title is linked back to the individual build article where performance testing can be validated. Tons of credit to this Cougar Blazer Gaming Case paired with Corsair fans and Corsair iCue RGB software which make this our most attractive case to date
TSSDR ASROCK CREATOR GEN 4 X570 TEST BENCH (link)
| PC CHASSIS: | Cougar Blazer Open Frame Gaming Mid-Tower Case |
| MOTHERBOARD: | ASRock X570 Creator PCIe 4.0 |
| CPU: | AMD Ryzen 3700x |
| CPU COOLER: | Corsair Hydro H150i Pro RGB 360mm Liquid Cooling |
| POWER SUPPLY: | Corsair RM850x 80Plus |
| GRAPHICS: | MSI Armor Mk 2 Radeon RX570 OC |
| MEMORY: | Corsair Vengeance LPX DDR4 3600MHz |
| STORAGE: | Intel Optane 905P 1.5TB SSD |
| KEYBOARD: | Corsair K57 Wireless Gaming |
| MOUSE: | Corsair Dark Core RGB SE Wireless BT Gaming |
| OS | Microsoft Windows 10 Pro 64 Bit |
BENCHMARK SOFTWARE
The software in use for today’s analysis is typical of many of our reviews and consists of Crystal Disk Info, ATTO Disk Benchmark, Crystal Disk Mark, AS SSD, Anvil’s Storage Utilities, AJA, and TxBench. Our selection of software allows each to build on the last and to provide validation to results already obtained.
Crystal Disk Info is a great tool for displaying the characteristics and health of storage devices. It displays everything from temperatures, the number of hours the device has been powered, and even to the extent of informing you of the firmware of the device.
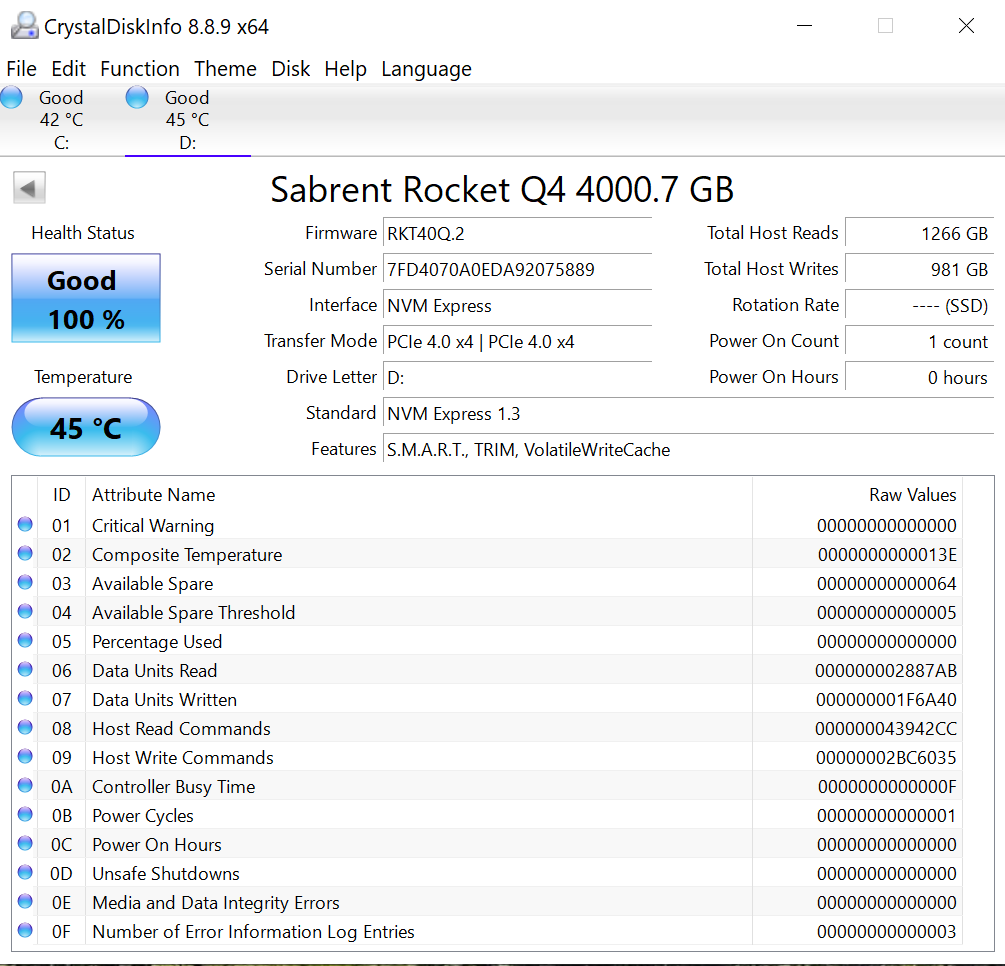
Crystal Disk Info validates that our SSD is running in PCIe 3.0 x4 (four lane), and also that NVMe 1.3 protocol is in use.
ATTO Disk Benchmark is perhaps one of the oldest benchmarks going and is definitely the main staple for manufacturer performance specifications. ATTO uses RAW or compressible data and, for our benchmarks, we use a set length of 256mb and test both the read and write performance of various transfer sizes ranging from 0.5 to 8192kb. Manufacturers prefer this method of testing as it deals with raw (compressible) data rather than random (includes incompressible data) which, although more realistic, results in lower performance results.
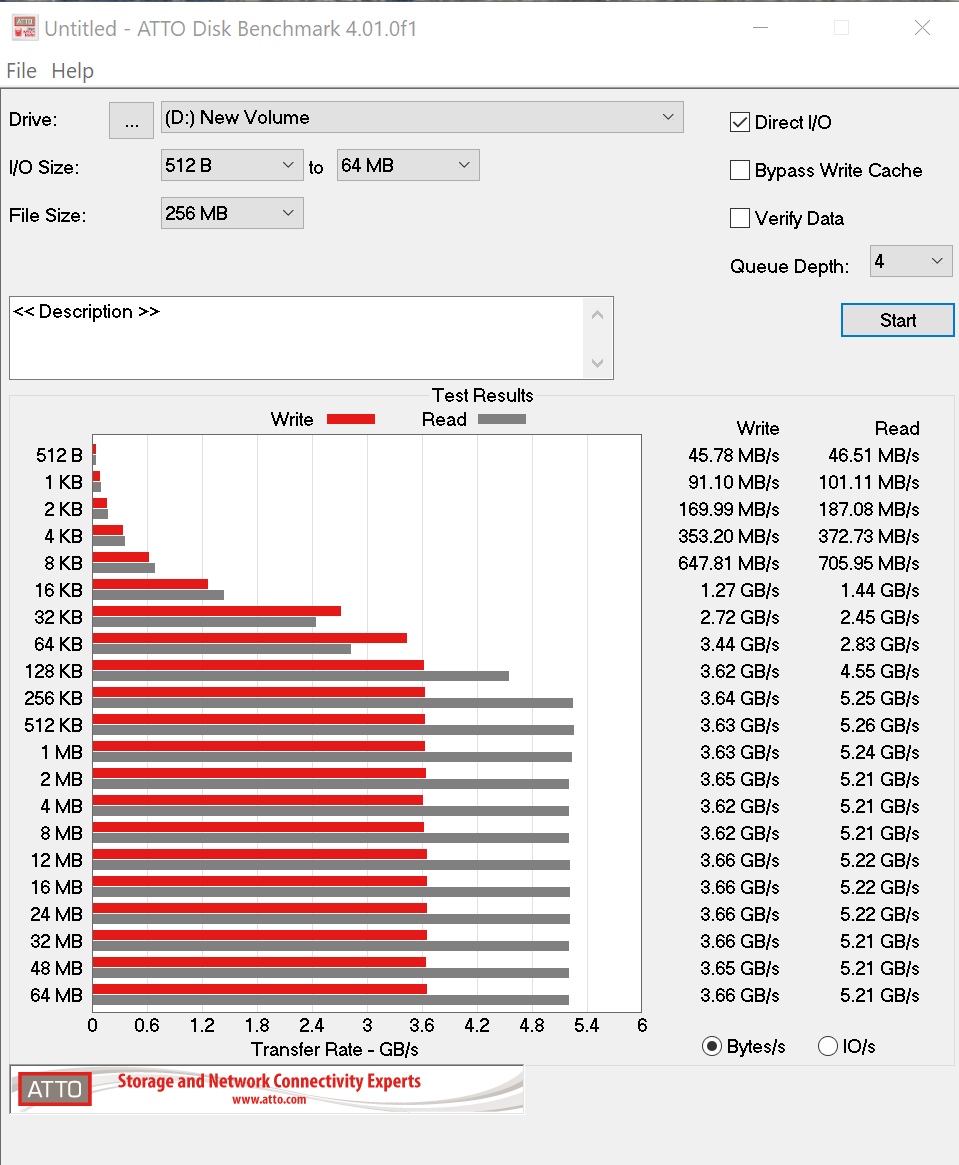
Atto provides us with preliminary performance results of 5.22GB/s read and 3.66GB/s write. It is also a definite positive to see performance at a steady increase commensurate with data sample size increase.
Dear Les,
I think there is a typo in the last few sentences on the first page, were the per seconds part should not be there after the capacity in megabyte (gigabyte, after all?) “… 3725MB/s available for user storage once formatted …”
Is the difference related to the 1000 vs 1024 marketing thingy or simply to overprovisioning practices.
Also, while on topic of overprovisioning. I usually format and partition SSDs with Partition Guru. The way I do it is dividing the total capacity in bytes by the number of storage chips on the drive. Then I divide this by eight, so that I know how many 4K(=8 times 512 bytes) aligned sectors essentially there are. Then I size the very first part for EFI System Partition (ESP) to be large enough to contain the recommend 100 megabytes size. Whatever the amount in bytes, I subtract this from the result of the division, and create the first NTFS partition so that the sum of “the very first MBR sector + ESP + the first partition” is exactly, down to the byte, as large as a single chip can hold. To size the remaining partitions is simpler, as from that point on I only have to decide on exactly how many chips a given partition spans out over.
So, I usually get extremely, really down to the bytes precise results when examining the sector count boundaries afterwards. But on rare occasions I just brick the drive, simple as that …
And that made me wonder in trying to be this precise I inadvertedly wreak havoc in the overprovisioning proper, i.e. the way it is engineered on circuit logic level.
So, long story short, my question proper:
The overprovisioned part, say X percentage of a drive’s total capacity is …
a) an a single allocated and continuous area on one of the chips?
or
b) this X percentage is further divided by the number of chips, and each of them contains an equal sized OP area (the sum of which essentially being the X percentage in total)?
I do hope you can enligthen me 😉
Kind regards,
-Christian
Unfortunately, I cannot and thank you for replying. I don’t play with overprovisioning at all because…as you said… some drives brick. Typically, we want to test them to the extent that the reader can determine if it is the drive for them, and also so they can imitate same in their tests.