
CRYSTAL DISK BENCHMARK VER. 7.0.0 x64
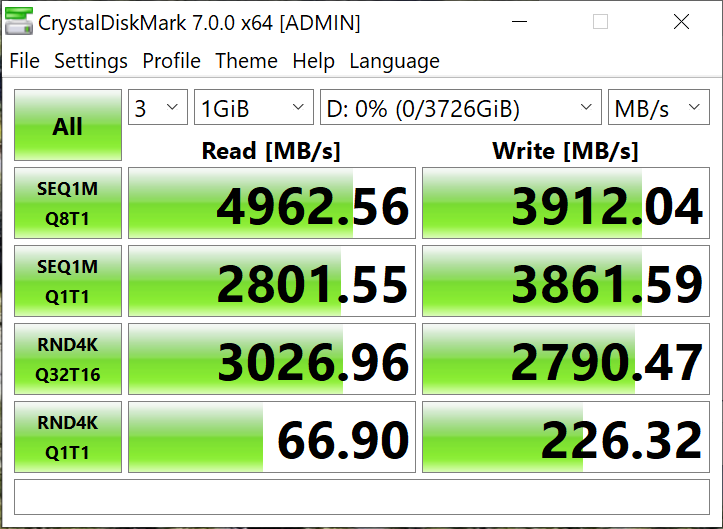
Crystal Disk Benchmark is used to measure read and write performance through sampling of random data which is, for the most part, incompressible. Performance is virtually identical, regardless of data sample so we have included only that using random data samples.
THROUGHPUT
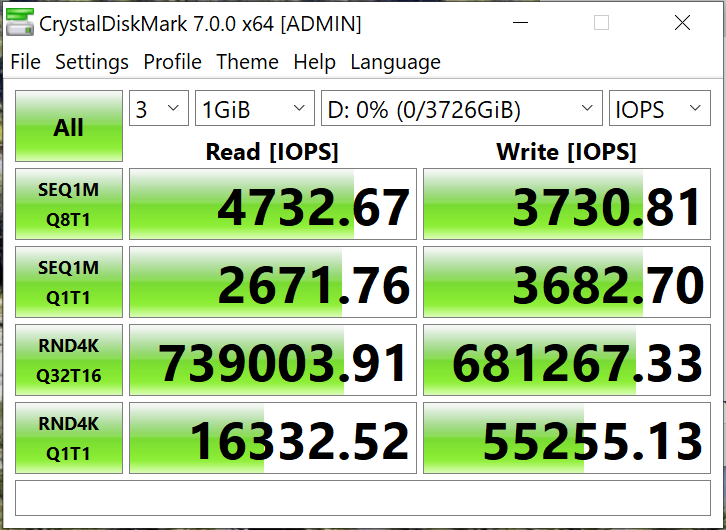
IOPS
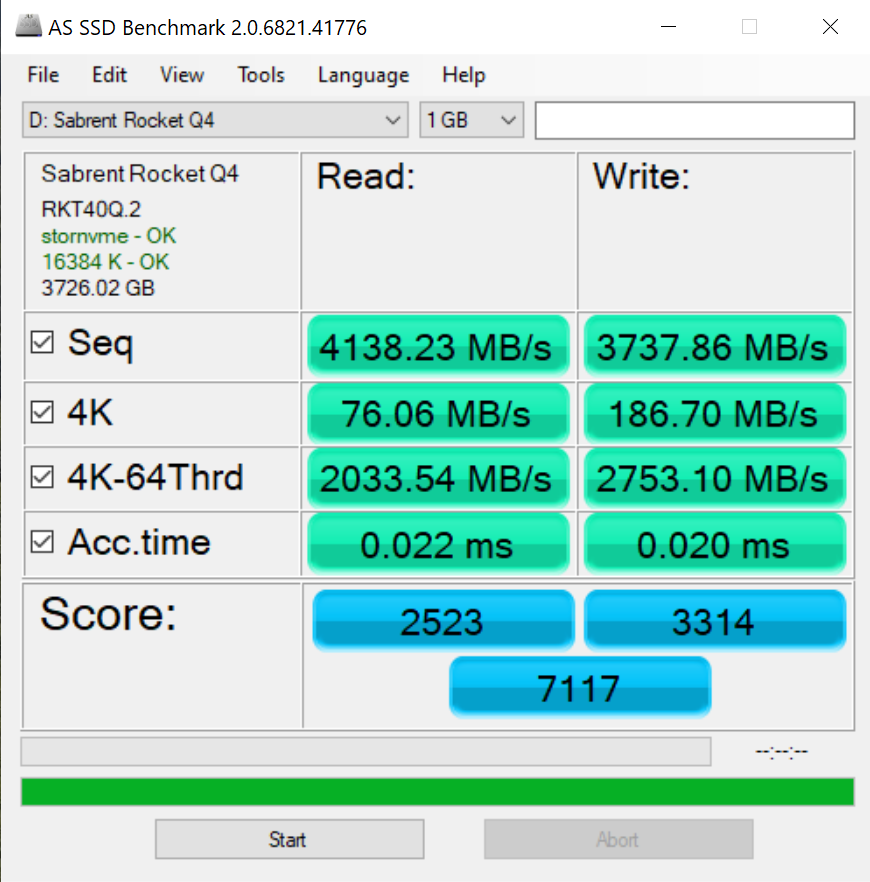
The toughest benchmark available for solid state drives is AS SSD as it relies solely on incompressible data samples when testing performance. For the most part, AS SSD tests can be considered the ‘worst case scenario’ in obtaining data transfer speeds and many enthusiasts like AS SSD for their needs. Transfer speeds are displayed on the left with IOPS results on the right.

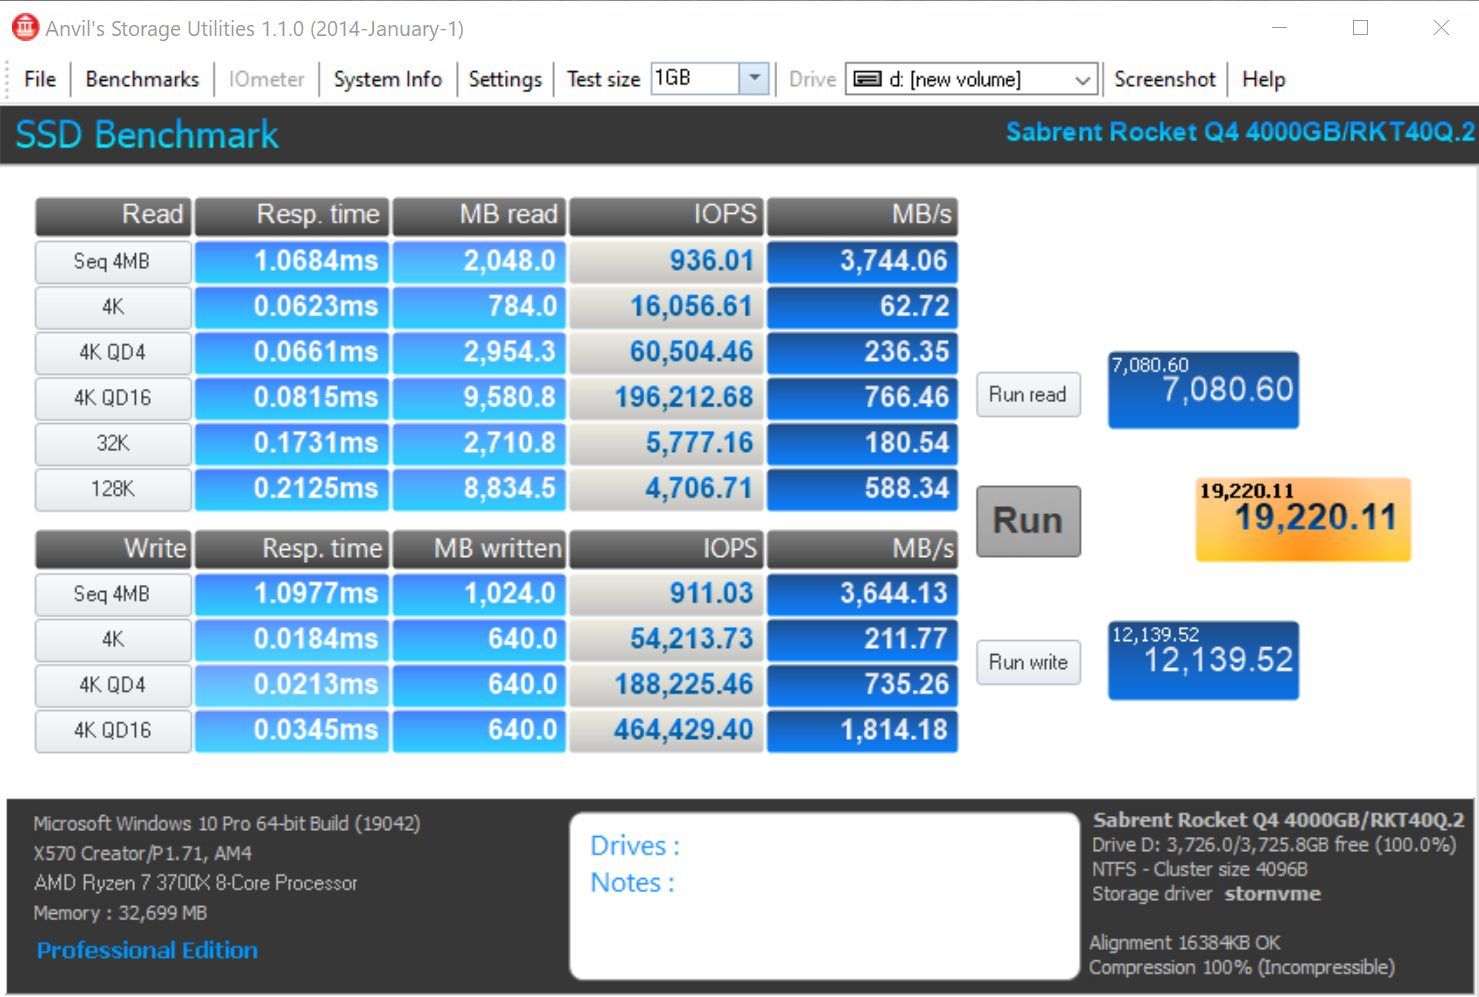
ANVIL STORAGE UTILITIES PROFESSIONAL
Anvil’s Storage Utilities (ASU) are the most complete test bed available for the solid state drive today. The benchmark displays test results for, not only throughput but also, IOPS and Disk Access Times. Not only does it have a preset SSD benchmark, but also, it has included such things as endurance testing and threaded I/O read, write and mixed tests, all of which are very simple to understand and use in our benchmark testing.
Dear Les,
I think there is a typo in the last few sentences on the first page, were the per seconds part should not be there after the capacity in megabyte (gigabyte, after all?) “… 3725MB/s available for user storage once formatted …”
Is the difference related to the 1000 vs 1024 marketing thingy or simply to overprovisioning practices.
Also, while on topic of overprovisioning. I usually format and partition SSDs with Partition Guru. The way I do it is dividing the total capacity in bytes by the number of storage chips on the drive. Then I divide this by eight, so that I know how many 4K(=8 times 512 bytes) aligned sectors essentially there are. Then I size the very first part for EFI System Partition (ESP) to be large enough to contain the recommend 100 megabytes size. Whatever the amount in bytes, I subtract this from the result of the division, and create the first NTFS partition so that the sum of “the very first MBR sector + ESP + the first partition” is exactly, down to the byte, as large as a single chip can hold. To size the remaining partitions is simpler, as from that point on I only have to decide on exactly how many chips a given partition spans out over.
So, I usually get extremely, really down to the bytes precise results when examining the sector count boundaries afterwards. But on rare occasions I just brick the drive, simple as that …
And that made me wonder in trying to be this precise I inadvertedly wreak havoc in the overprovisioning proper, i.e. the way it is engineered on circuit logic level.
So, long story short, my question proper:
The overprovisioned part, say X percentage of a drive’s total capacity is …
a) an a single allocated and continuous area on one of the chips?
or
b) this X percentage is further divided by the number of chips, and each of them contains an equal sized OP area (the sum of which essentially being the X percentage in total)?
I do hope you can enligthen me 😉
Kind regards,
-Christian
Unfortunately, I cannot and thank you for replying. I don’t play with overprovisioning at all because…as you said… some drives brick. Typically, we want to test them to the extent that the reader can determine if it is the drive for them, and also so they can imitate same in their tests.