
The SSD Review uses PCMark 8’s Storage test suite to create testing scenarios that might be used in the typical user experience. With 10 traces recorded from Adobe Creative Suite, Microsoft Office and a selection of popular games, it covers some of the most popular light to heavy workloads. Unlike synthetic storage tests, the PCMark 8 Storage benchmark highlights real-world performance differences between storage devices. After an initial break-in cycle and three rounds of the testing, we are given a file score and bandwidth amount. The higher the score/bandwidth, the better the drive performs.
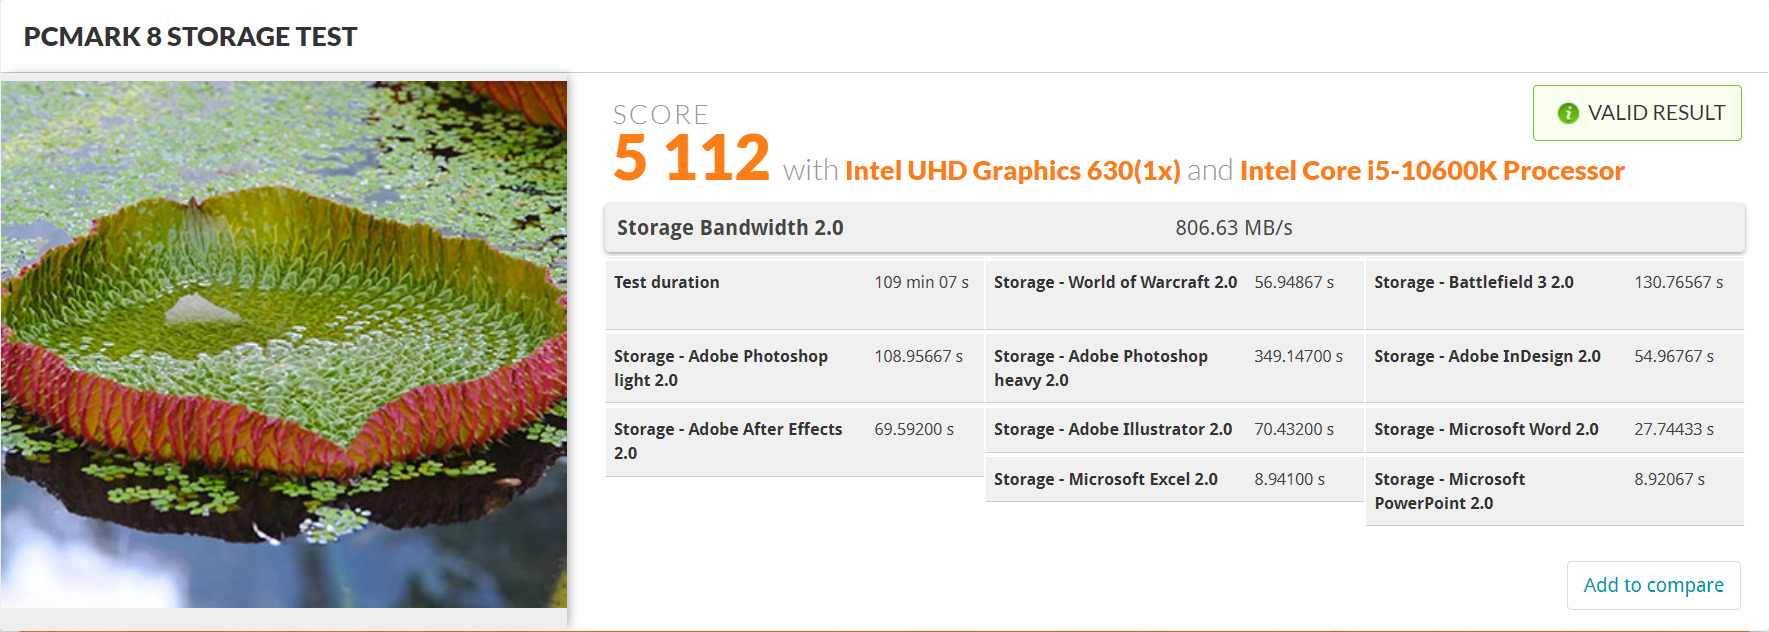
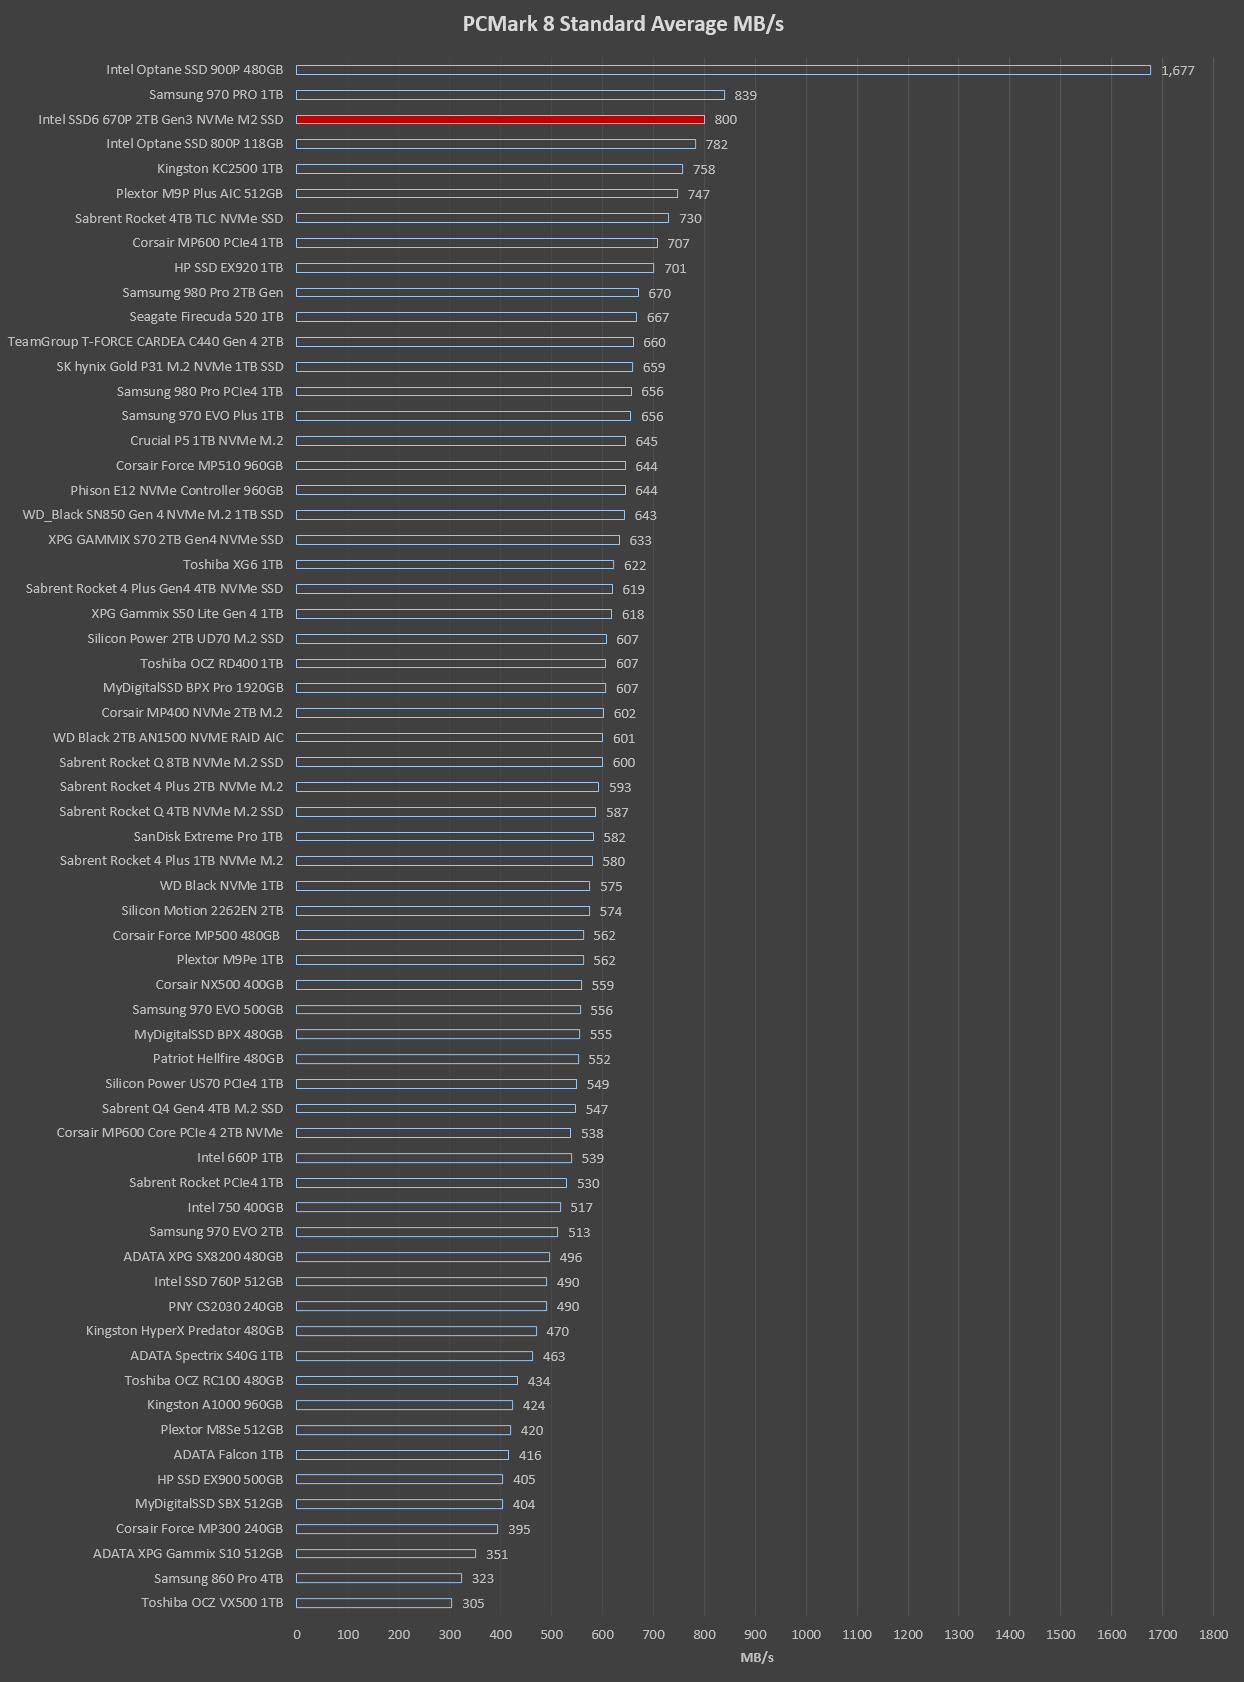
The Intel SSD6 670p NVMe SSD has one of the best results we have ever seen in PCMark 8, inclusive of both Gen 3 and Gen 4. This is the 3rd best result we have ever seen in this software.
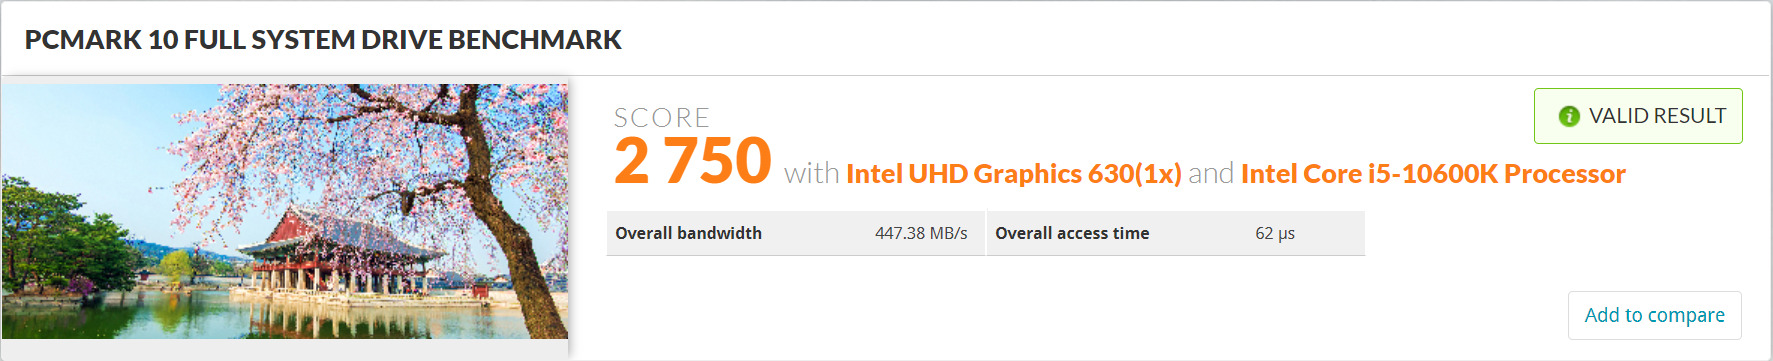
PCMARK 10 FULL SYSTEM STORAGE BENCHMARK
PCMark 10 Storage Benchmarks produce an overall score as a measure of drive performance. Comparing devices is as simple as comparing scores. The tests also measure and report the bandwidth and average access time performance for the drive. Each test uses traces recorded while performing real-world tasks such as booting Windows 10, starting applications such as Adobe Photoshop and Illustrator, working with applications such as Microsoft Excel and PowerPoint, and copying several large files and many small files.
REAL WORLD FILE TRANSFER COMPARISON
We have put the Intel SSD6 670p NVMe SSD NVMe SSD beside a number of QLC level PCIe 3.0 SSDs for our true to life data testing. In this test, we simply place 15GB files representing music, video, pictures and operating systems onto the target drive. We then copy each file from one place on the target disk to another, recording the time taken for the transfer.
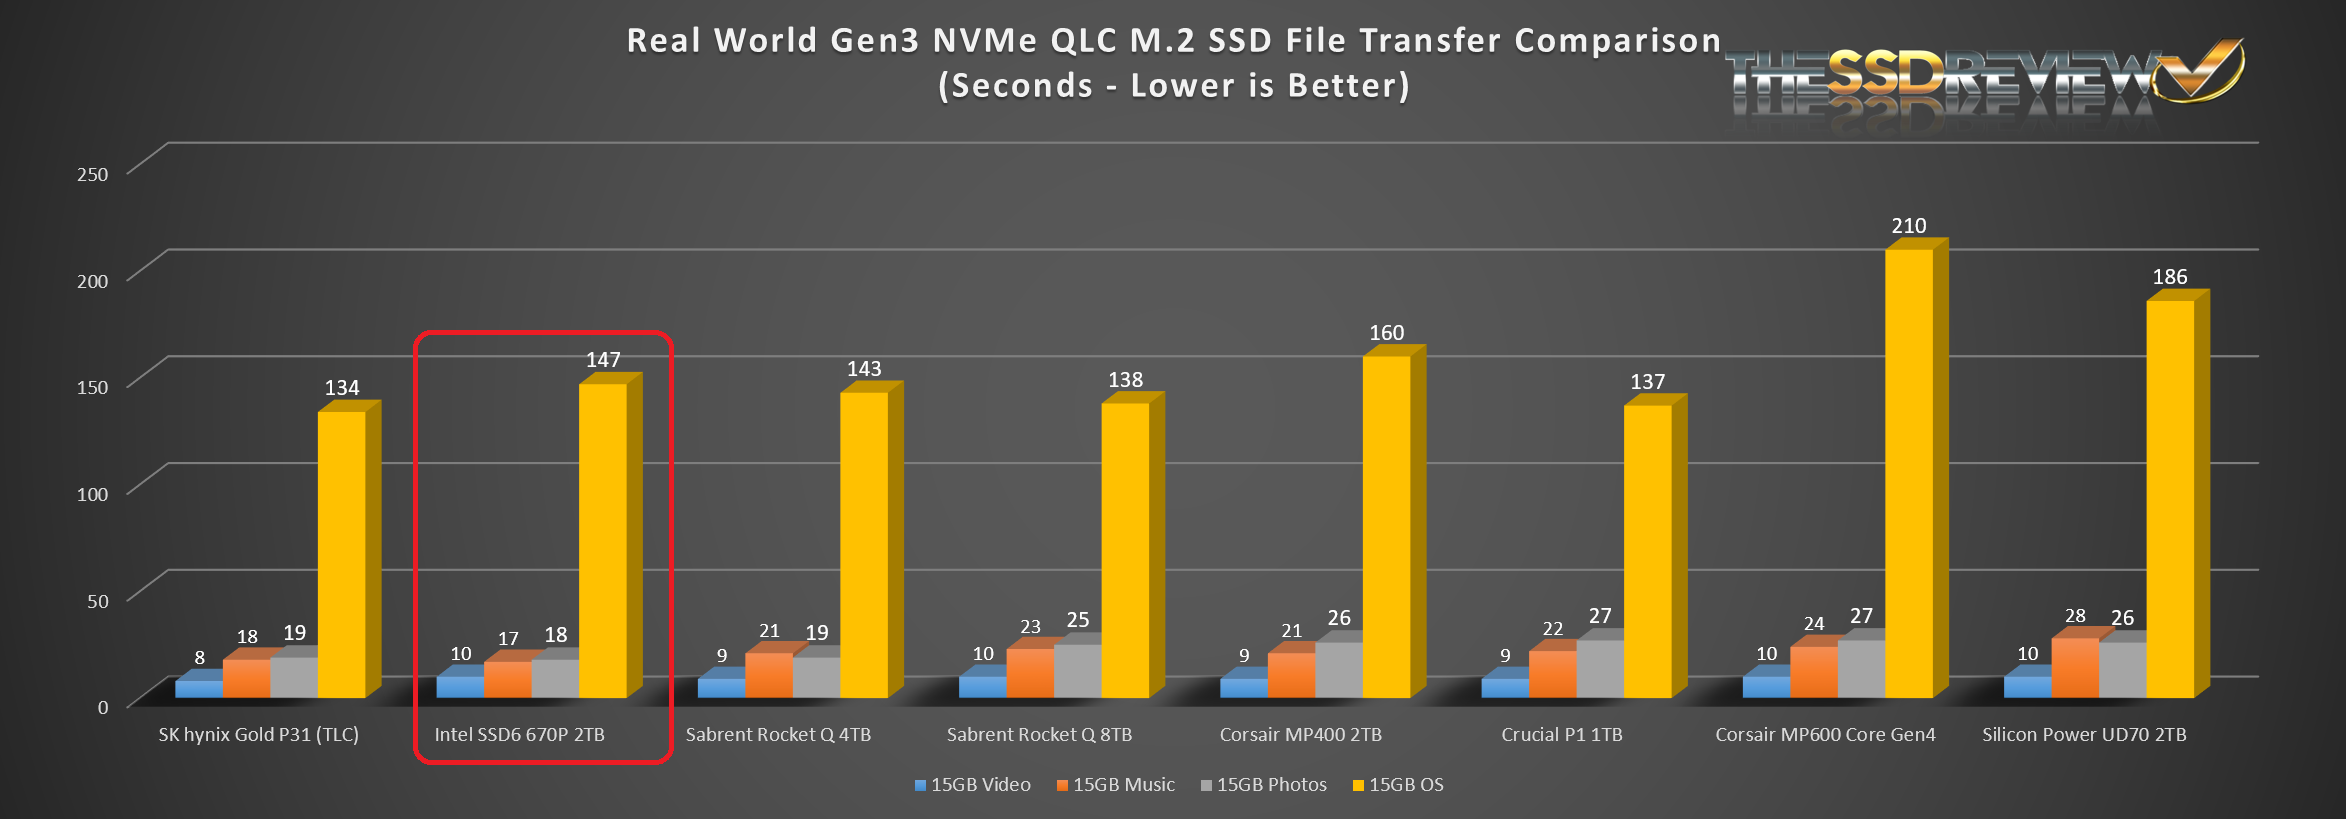
In true data transfer, the 670p is the best QLC SSD we have tested to date. The result to the left of it is our testing of the TLC NAND SK Hynix Gold P31 SSD which is the best TLC SSD tested. This demonstrates just how close TLC and QLC performance is getting.
INTEL MAS PERFORMANCE BOOSTER
The Intel MAS Performance Booster is rather unique to Intel and clears the internal cache of the 670p.
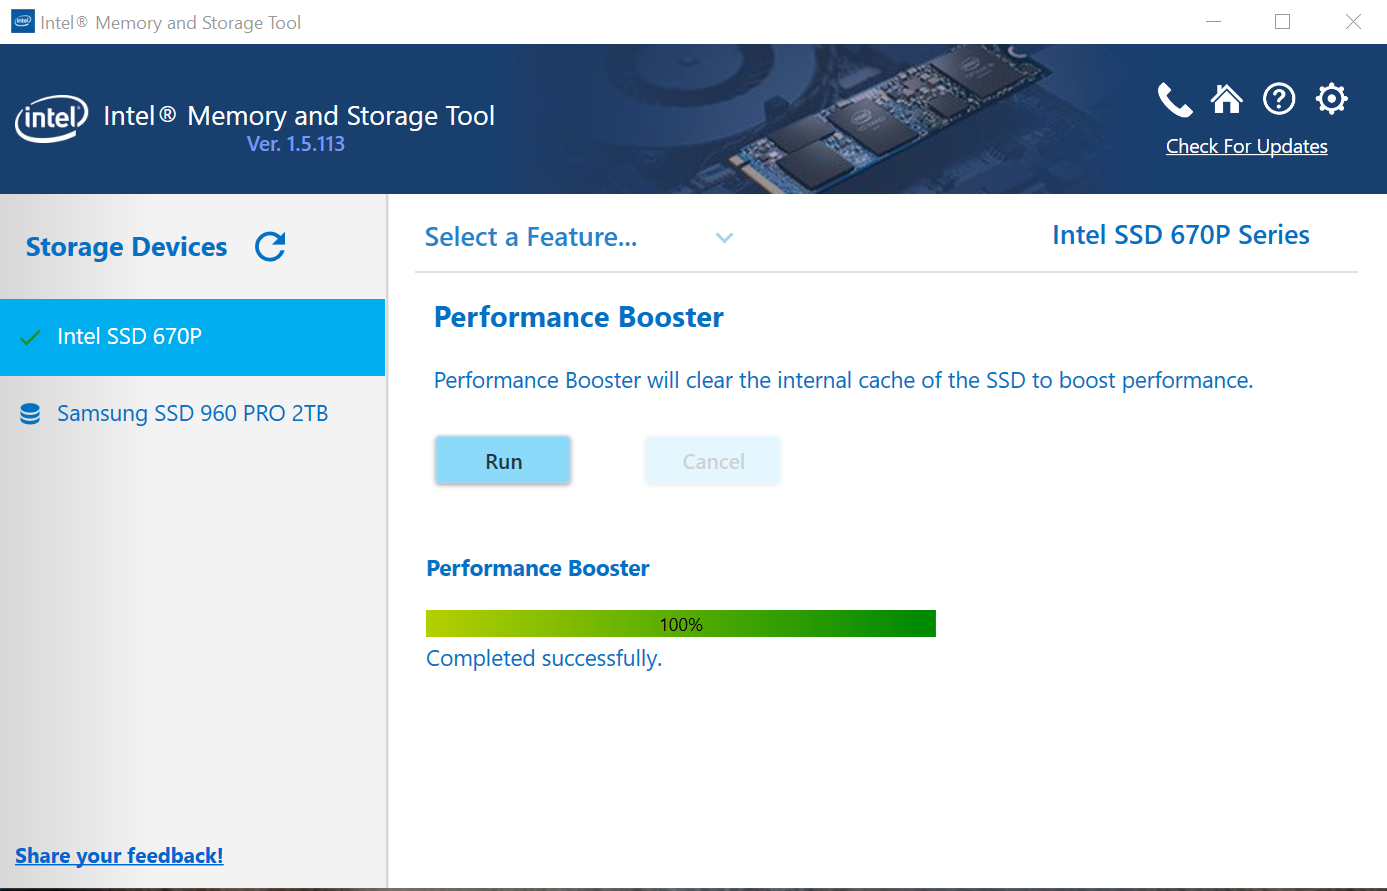
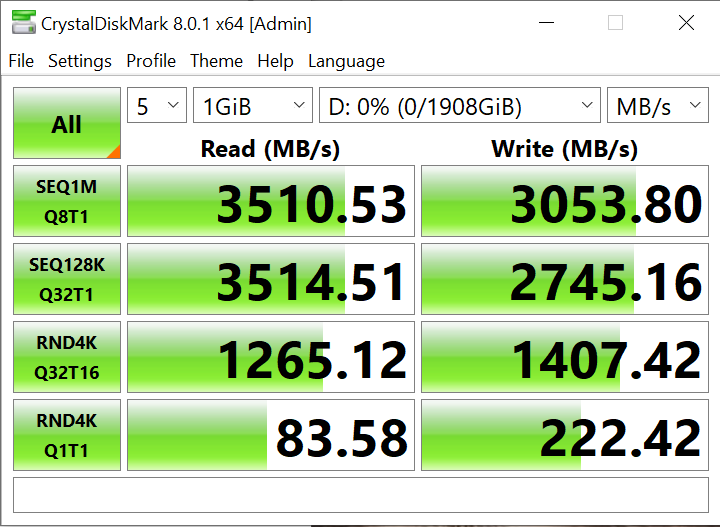
In testing this feature, we found that there was a ‘speed boost’ post application of the Performance Booster as shown with these Crystal DiskMark results in comparison to our earlier results:
THROUGHPUT
IOPS

Hey there Les, thanks for the review. From the benchmarks you’ve posted this seems like a great drive, especially for a drive with QLC flash. I am concerned that the performance will drop significantly when the drive is full of data, because it uses QLC and it has a Silicon Motion controller, and Silicon Motion optimizes its controllers to have strong performance when empty. Do you have any performance benchmarks when the drive is full of data, or 80% / 90% full?
Thank you for your interest in our website and welcome. Unfortunately, we haven’t traditionally done fill testing and have no plans to do such for this SSD at this time. If something should change, we will amend the report accordingly.
Les
What is the reliability (in P/E cycles) of the NAND that Intel used for this drive?