
REPORT ANALYSIS AND FINAL THOUGHTS
Right off the bat, let’s eliminate any question as to whether our tests in this report could be considered valid for anything but to see what we speeds we could attain. There is no steady state testing involved and we simply wanted to put forward a brief report on some of the results we attained playing around in the lab. Having said that…
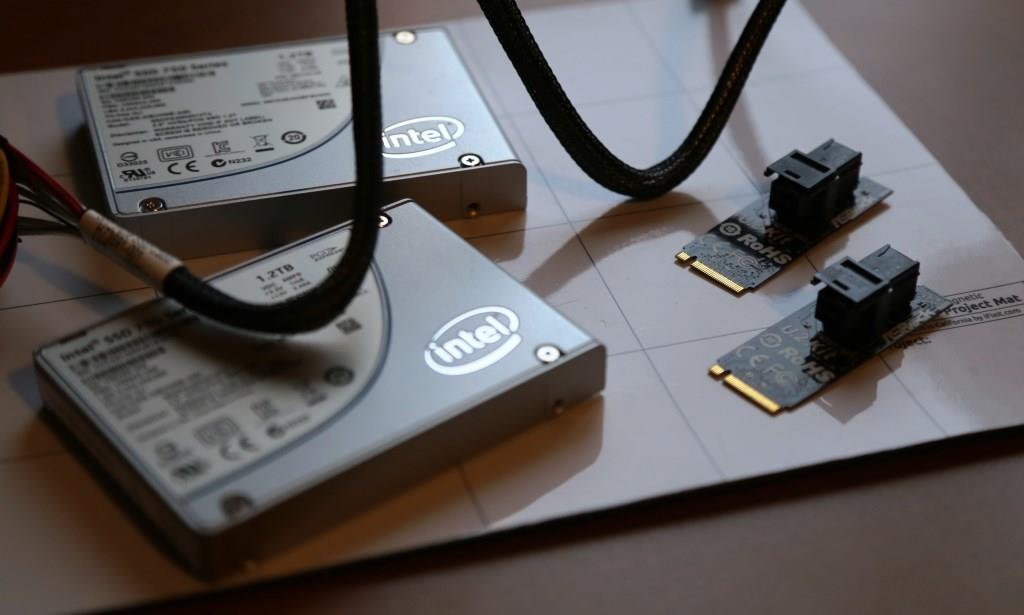
The strength of NVMe in SSD storage is evident. Where today we were able to reach 5.3GB/s throughput and 755,000 IOPs with three SSDs, it took eight HGST enterprise SSDs to reach a slightly higher result less than two years ago. The difference, of course, is that these are retail SSDs that the consumer has easy access to. Without a doubt, Intel has marked its place as an innovator in storage and has made NVMe available for the consumer where it will take many others some time to accomplish same.
Today’s look at solid state technology has actually taken on a very interesting look from just a few years back. NVMe is being proven to be tomorrow’s technology today and both Intel and Samsung have introduced NVMe solutions to enterprise, oem and retail. Although this will filter to third-party vendors eventually, both companies seem to have taken a stronghold in an industry that has been push and shove for some time. As much as the fallout has been some hardware manufacturers moving away from SSDs, amazing performance at lower prices is a boon for all with no stop in sight. Who knows… perhaps declining HDD sales will be next.
Just a great article! Really good job on the test. I thought the DMI 3 speed of 3.93 GB/s would affect performance, and yet it didn’t. How come?
because they used 1 pcie ssd which is connected to the cpu directly
the other 2 are connected through dmi
Guys, I believe:
1) [b]ATTO READ results are victim of 32bit overflow [/b]. 1024kB block show result of 4053109kB/s (=4GB/s), 2048kB block size only shows 700729kB/s caused by the 32bit overflow. This is AFTER it crossed 4GB/s threshold (2^32 = 4194304kB/s) so the TOTAL write speed in fact was 4GB/s + 0.7GB/s = 4.7GB/s. As I say, ATTO can NOT count with bigger than 32bit numbers internally, so that’s the reason why it only displays 0.7GB/s instead of what it should be 4.7GB/s. The same thing applies to 4096kB and 8192kB block size results, they SHOULD be 4.96GB/s and 4.99GB/s.
There is no other explanation for such cruel drop in performance when going up from 1024kB block size to 2048, 4096 and 8192kB blocks. Just the results are displayed incorrectly.
My table :
size write read
1024 3614841 4053109 [no overflow here, 4194304 is the break point, 2^32 = 4194304]
2048 3681783 700729 [should be 4194304+700729 = 4859033]
4096 3768675 967166 [should be 4194304+967166 = 5161470]
8192 3863339 993412 [should be 4194304+993412 = 5187718]
These results are PERFECTLY aligned with Crystal DiskMark results on second page. Crystal gets to 5353MB/s which is the same league as numbers displayed here.
Write performance is obviously not affected with this, because it only gets to 3863339kB/s maximum which is below 2^32 = 4194304kB/s. SSDs simply can’t write faster. But they can read.
2) it would be possible to squeeze out little bit more than 755k IOPS (4kB) in IOMeter test on last page. I see 0.6245ms AVERAGE latency for this 4kB test, what in my experience shows disk subsystem being not utilized to its maximum capabilities.
In SSD RAID tests, I personally have ALWAYS achieved higher IOPS when my latency got above 1ms, quite often above 2ms, (example : I achieve 60.000 IOPS 4kB random read with 0.8ms latency where I sit ; the same config shows 80.000 IOPS 4kB random read with 2ms when I kick it to higher queue depths or more workers).
My thought is supported by all three remaining IOMeter tests which show 12.5332ms average latency when testing sequential throughput resulting in 5353.58MB/s (first IOMeter screenshot on last page), 16.8915ms latency 3971.78MB/s throughput (second screenshot) and 2.3510ms latency in the last screenshot.
Compared to those latencies (2.35ms, 12.53ms and 16.89ms), the average 4kB read test latency of 0.6245ms possibly was not taxing RAID to the maximum possible extent.
We’re starting to hit the really intoxicating performance levels here. When you consider that you can get 2 800Gb units for about $800 and RAID0 them that’s a damn bargain.
These adapters are available:
https://www.scan.co.uk/products/asus-hyper-kit-u2-card-m2-(pcie)-to-mini-sas-hd-sff8639-for-connecting-25-intel-750-ssds-to-motherbo
It’s interesting how Intel can provide 3 new 750s for a raid 0 review, but can’t provide 1 mainstream 535 2.5 ssd for review to any site and it’s been out for a while now.
Is there a recommendation for enterprise use with regard to RAID 1 and the SSD form factor NVMe drives? I know the PICe-attached ones are built to be single devices, but the 2.5 inch form factor, do I need to use RAID 1 in production?