
With the posting of two Intel 750 SSD Reviews, and our more recent article clarifying the U2 (SFF-8639) connector on the Intel 750, this NVMe SSD has received a bit of play as of late. Considering we have three 1.2TB 750s on hand, a few RAID tests were in order and we thought we might compile a bit of a report to get these numbers out.
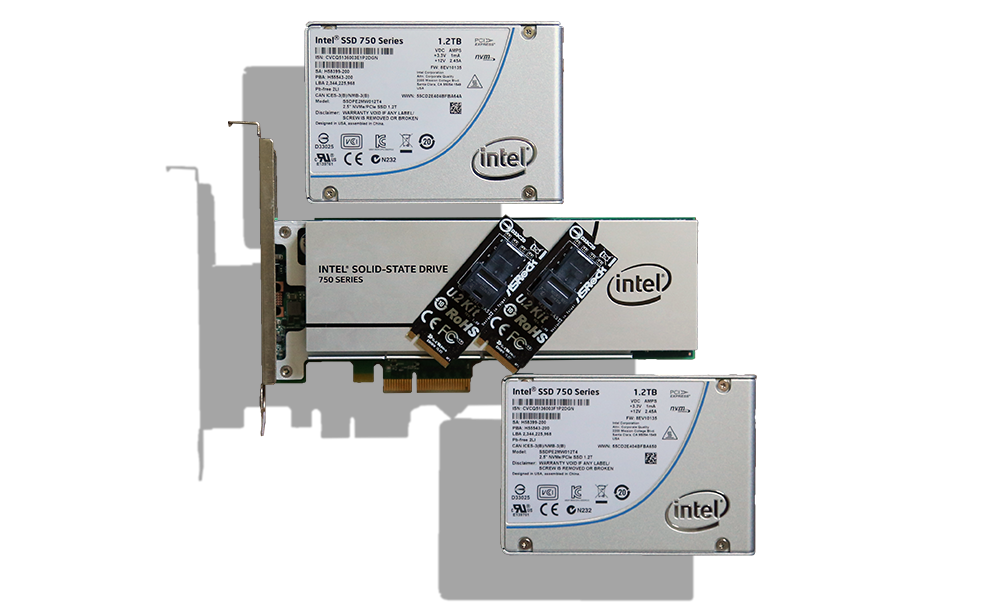
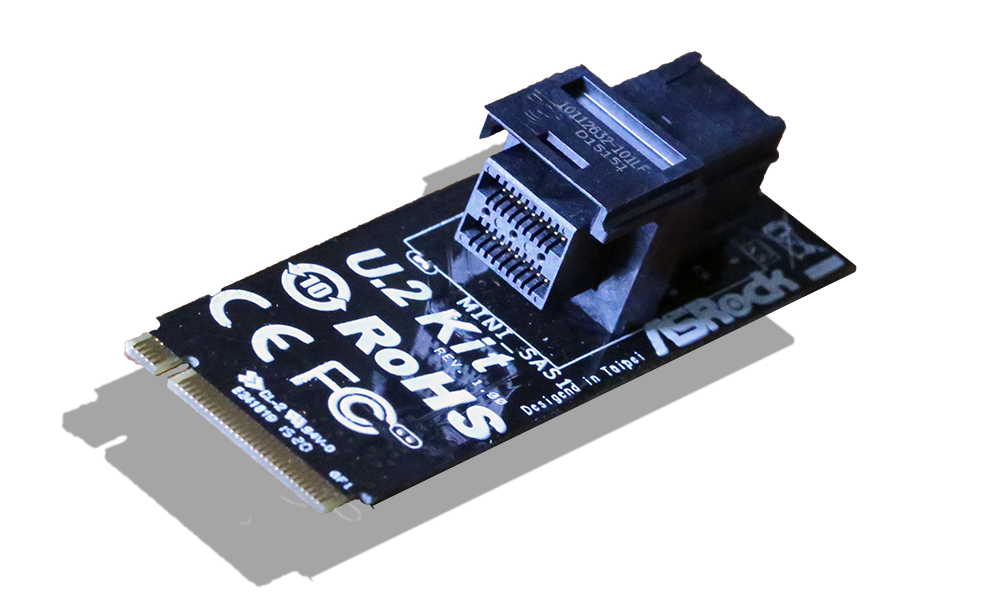
Two of our 750 Series NVMe SSDs are of the newest U2 (SFF-8639) form factor and the other is an AIC (add-in Card). Our thanks to ASRock for sending us two U.2 to M2 adapters, as these are still impossible to find in open retail. These adapters fit into the M.2 slot of newer motherboards and, as long as that connector accommodates PCIe 3.0 X4, loss of performance is no concern whatsoever.
 In this scenario, we are using the ASRock Z170 Extreme7 motherboard and it houses three such M.2 slots. In addition, ASRock tackled all angles in setting up the UEFI with the latest version of Intel RST, enabling the RAIDing of all three M.2 SSDs right in the BIOS. We have tested this combination, as well as a few other SSD RAID scenarios, in both the BIOS RAID and OS software RAID setup and were able to confirm that performance in both is the same.
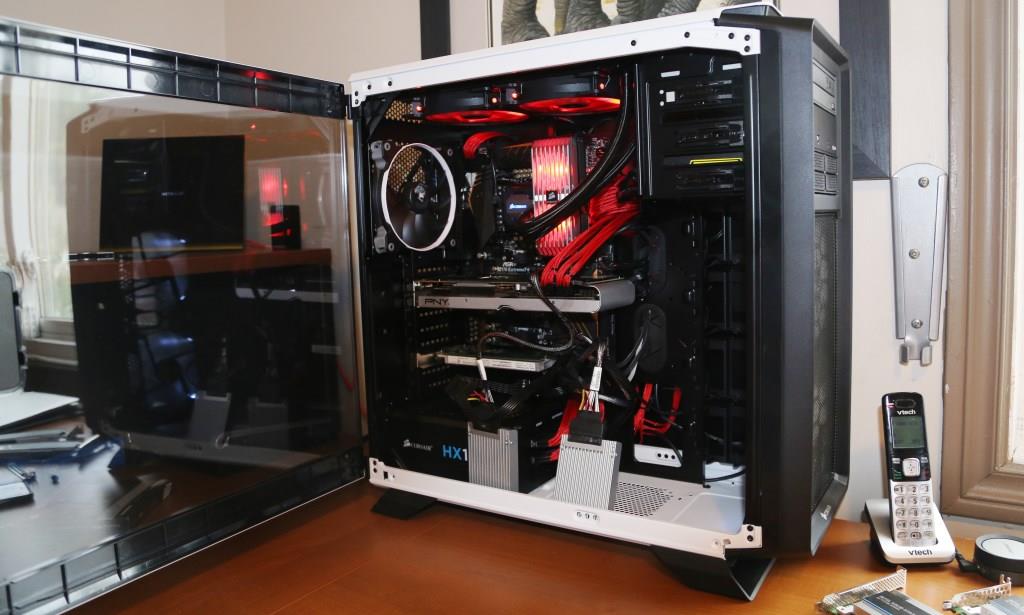
This picture of our newest TSSDR Z170 Test Bench shows it hard at work testing the Intel 750 Series NVMe SSDs in RAID 0.
TSSDR Z170 TEST BENCH COMPONENTS
Our Z170 Test Bench was built with the sponsorship of Corsair, ASRock, Intel, and PNY, all of whom have our sincere appreciation. This is a relatively high-end PC and all of the components used for testing can be purchased at a reasonable price. The links below can assist in pricing and availability for those interested in this equipment:
| PC CHASSIS: | Corsair 760T White Full Window |
| MOTHERBOARD: | ASRock Z170 Extreme7+ ATX DDR4 |
| CPU: | Intel I7-6700K 4.00 GHz |
| CPU COOLER: | Corsair Hydro Series H110i GTX |
| POWER SUPPLY: | Corsair HX1200i ATX12V |
| GRAPHICS: | PNY GTX 980 4GB XLR8 Pro OC |
| MEMORY: | Corsair Dominator Pl 32GB 2800 |
| STORAGE: | Intel 750 Series 1.2TB NVMe SSD |
| KEYBOARD: | Corsair Vengeance K70 Mech |
| MOUSE: | Corsair White M65 Laser |
| OS | Microsoft Windows 10 Home 64 Bit |
BENCHMARK SOFTWARE
The software used for this report is typical of many of our reviews and consists of ATTO Disk Benchmark, Crystal DiskMark, AS SSD, Anvil Storage Utilities, PCMark Vantage and IOMeter. In consumer reports, we prefer to test with easily accessible software that the reader can obtain, and in many cases, we even provide the links. Our selection of software allows each to build on the last and to provide validation of results already obtained.
ATTO Disk Benchmark is a relatively easy-to-use benchmark tool, which happens to be the benchmark of choice for many manufacturers. ATTO uses compressible data rather than random data, which results in higher performance and thus, higher benchmark scores. In our testing, we have selected the transfer size to range from 0.5KB to 8192KB, and have set the total length of the test to be 256MB.
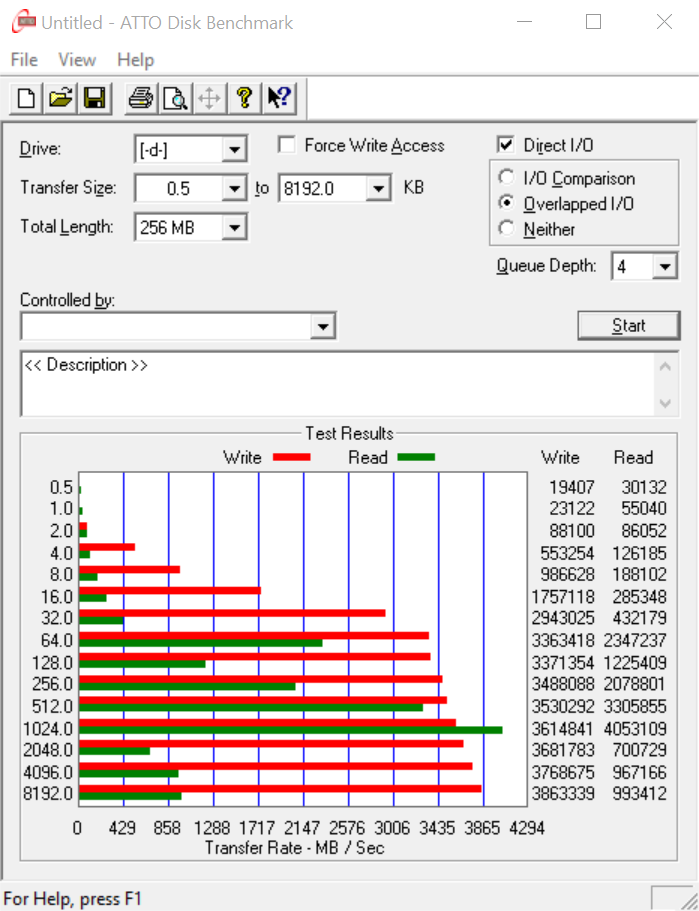
We can see that ATTO wasn’t so comfortable testing in this particular NVMe RAID scenario which isn’t really much of a surprise. We would like to have seen a steady speed increase commensurate with data sample size and high speeds of 4GB/s read and 3.7GB/s write weren’t quite what we were hoping to see. Several tests were conducted to confirm this, all having similar results.
Just a great article! Really good job on the test. I thought the DMI 3 speed of 3.93 GB/s would affect performance, and yet it didn’t. How come?
because they used 1 pcie ssd which is connected to the cpu directly
the other 2 are connected through dmi
Guys, I believe:
1) [b]ATTO READ results are victim of 32bit overflow [/b]. 1024kB block show result of 4053109kB/s (=4GB/s), 2048kB block size only shows 700729kB/s caused by the 32bit overflow. This is AFTER it crossed 4GB/s threshold (2^32 = 4194304kB/s) so the TOTAL write speed in fact was 4GB/s + 0.7GB/s = 4.7GB/s. As I say, ATTO can NOT count with bigger than 32bit numbers internally, so that’s the reason why it only displays 0.7GB/s instead of what it should be 4.7GB/s. The same thing applies to 4096kB and 8192kB block size results, they SHOULD be 4.96GB/s and 4.99GB/s.
There is no other explanation for such cruel drop in performance when going up from 1024kB block size to 2048, 4096 and 8192kB blocks. Just the results are displayed incorrectly.
My table :
size write read
1024 3614841 4053109 [no overflow here, 4194304 is the break point, 2^32 = 4194304]
2048 3681783 700729 [should be 4194304+700729 = 4859033]
4096 3768675 967166 [should be 4194304+967166 = 5161470]
8192 3863339 993412 [should be 4194304+993412 = 5187718]
These results are PERFECTLY aligned with Crystal DiskMark results on second page. Crystal gets to 5353MB/s which is the same league as numbers displayed here.
Write performance is obviously not affected with this, because it only gets to 3863339kB/s maximum which is below 2^32 = 4194304kB/s. SSDs simply can’t write faster. But they can read.
2) it would be possible to squeeze out little bit more than 755k IOPS (4kB) in IOMeter test on last page. I see 0.6245ms AVERAGE latency for this 4kB test, what in my experience shows disk subsystem being not utilized to its maximum capabilities.
In SSD RAID tests, I personally have ALWAYS achieved higher IOPS when my latency got above 1ms, quite often above 2ms, (example : I achieve 60.000 IOPS 4kB random read with 0.8ms latency where I sit ; the same config shows 80.000 IOPS 4kB random read with 2ms when I kick it to higher queue depths or more workers).
My thought is supported by all three remaining IOMeter tests which show 12.5332ms average latency when testing sequential throughput resulting in 5353.58MB/s (first IOMeter screenshot on last page), 16.8915ms latency 3971.78MB/s throughput (second screenshot) and 2.3510ms latency in the last screenshot.
Compared to those latencies (2.35ms, 12.53ms and 16.89ms), the average 4kB read test latency of 0.6245ms possibly was not taxing RAID to the maximum possible extent.
We’re starting to hit the really intoxicating performance levels here. When you consider that you can get 2 800Gb units for about $800 and RAID0 them that’s a damn bargain.
These adapters are available:
https://www.scan.co.uk/products/asus-hyper-kit-u2-card-m2-(pcie)-to-mini-sas-hd-sff8639-for-connecting-25-intel-750-ssds-to-motherbo
It’s interesting how Intel can provide 3 new 750s for a raid 0 review, but can’t provide 1 mainstream 535 2.5 ssd for review to any site and it’s been out for a while now.
Is there a recommendation for enterprise use with regard to RAID 1 and the SSD form factor NVMe drives? I know the PICe-attached ones are built to be single devices, but the 2.5 inch form factor, do I need to use RAID 1 in production?