
SERVER PROFILES CONTINUED
Our last set of profiles include File Server and Web Server workloads. As mentioned before the last hour of preconditioning, the average IOPS, and average latency for each QD is graphed below.
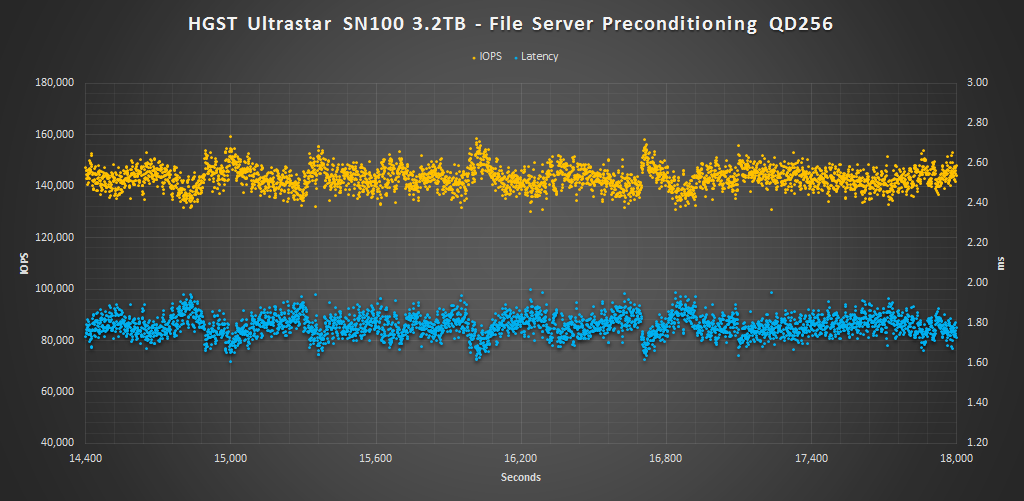

The File Server profile is based on an 80% read/20% write mix. It’s made up of block sizes from 512 to 64K, each making up a different percentage of the access pattern. The pattern is: 512 bytes=10%, 1k=5%, 2k=5%, 4k=60%, 8k=2%, 16k=4%, 32k=4%, 64k=10%.
During the File Server benchmark we can see very similar performance to that of our Email Server results. This time, however, it beats out the Intel P3608 a bit more. Under mixed workloads the SN100 seems to excel.
The Web Server profile is similar to the File Server profile, but has some additional 128K and 512K accesses thrown in for good measure. Additionally, the profile is 100% reads.
For the Web Server benchmark the SN100 finally shows some weakness. While it cakes the typical lead in lower queue depths, the SN100 falls behind once QD32 is reached. Overall, it reached 178K IOPS, which is about 65K IOPS shy of the Intel DC P3608’s performance at QD256.