
SERVER PROFILES
While synthetic 100% read or 100% write workloads do a great job of testing the underlying technology and reporting easy to understand results, they aren’t always indicative of how the drive will be used by the end user. Workloads that simulate enterprise environments try to bridge that gap without being overly complex. The process of measuring our server workload performance is the same as measuring random. The drive is first secure erased to get it in a clean state. Next, the drive is filled by sequentially writing to the RAW NAND capacity twice. We then precondition the drive with respective server workload at QD256 until the drive is in a steady state. Finally, we cycle through QD1-256 for 5 minutes each measuring performance. All this is scripted to run with no breaks in between. The last hour of RAID 0 preconditioning, the average IOPS, and average latency for each QD is graphed below.
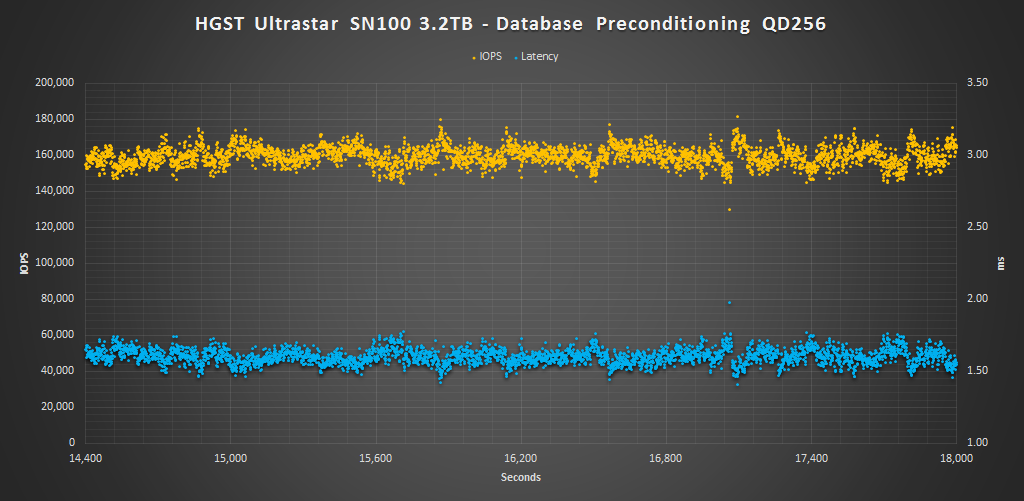

The Database profile is 8K transfers, and 67% percent of operations are reads.
During the Database benchmark at QD256 there is about a 30K IOPS in the distribution and latency maintained below 1.75ms on average. Performance peaked out at 180K IOPS. Looking at performance per QD it is plain and clear that the SN100 is takes the win during this type of workload. The SN100 was able to reach an average of 157K IOPS and up to QD128 latency remained under 1ms.
The Email Server profile is similar to the Database profile, only it 8K transfers at 50% reads and 50% writes.
During the Email Server benchmark high QD IOPS averages were the highest we have seen from a single drive SSD, surpassing even that of the Intel P3608! Again, latency is very well controlled until QD 128, after that it jumps from about 1ms to just over 2ms. IOPS consistency and latency was good at QD256 as well. IOPS ranged around 15K and latency ranged 0.5ms. So while it beats out the Intel here, consistency still is not as tight.