
MEASURING PERFORMANCE
To measure the most basic performance parameters, we first start with a secure erased drive. After logging some fresh numbers, we write over the entire LBA space with sequential writes twice, then write the capacity of the drive twice with 4K random writes. Once prepared, we run the following tests for one minute at each queue depth. Finally, we secure erase the drive and run the 4K read and write tests again to get a comparison between fresh and degraded performance states.
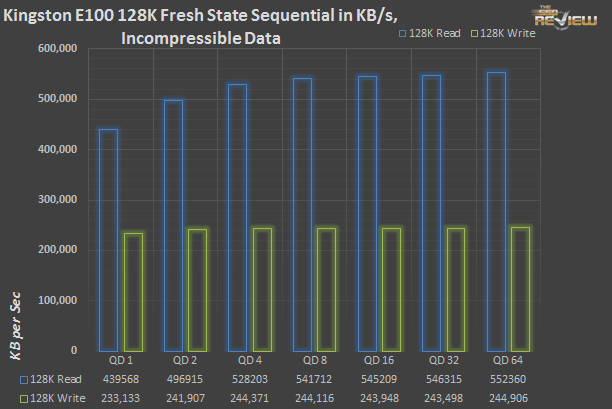
The E100 comes out blazing with out-of-the box performance hitting 552MB/s on sequential reads, while writes top 244MB/s, all with incompressible data.
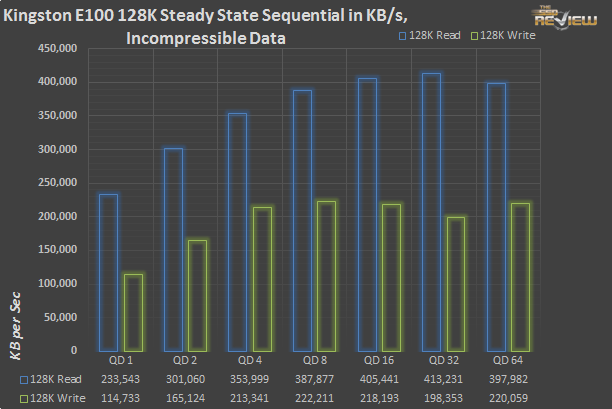
The story take a turn once the drive has been conditioned, though. Reads and writes both take it in the shorts: Sequential reads only manage 413MB/s, and writes are lower too. Its worth pointing out again that SandForce does all its garbage collection at write-time, so there tends to be a good deal of inconsistency between steady state runs.
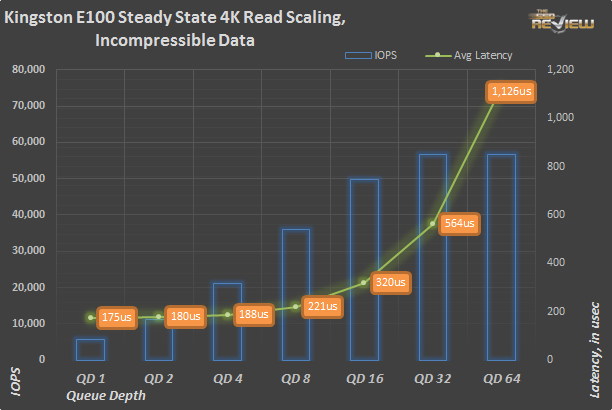
4K reads scale evenly up to 32 outstanding commands like all SandForce drives. QD1 random reads start at approximately 5,000 IOPS, but gently ramps up to 57,000K at QD32. Latency is excellent here as well, and we’ll look more closely at QD1 latency later. We’ll decline from showing the corresponding fresh-out-of-box chart, as it’s basically identical.
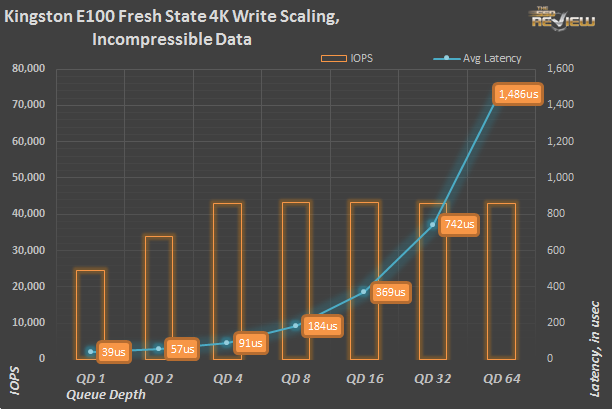
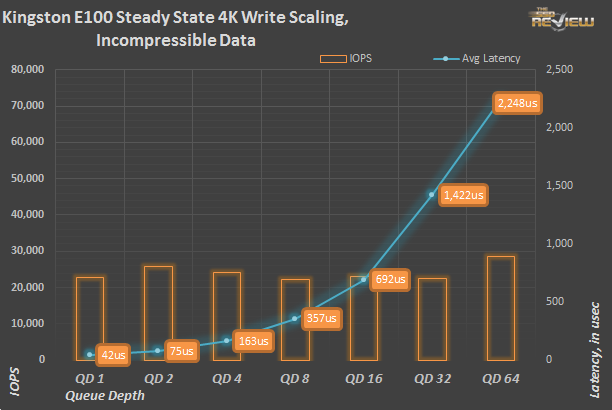
The Kingston drops a hearty 42,000 IOPS with incompressible data in the 4K write testing. After writing the drive’s capacity four times however, the going gets a bit harder. The Kingston fights back, and pulls down 26,000 4K IOPS at QD2. Average latency is nothing to sneeze at, as well and rare is the MLC-based SandForce drive that can top this.