
SNIA IOPS TESTING
The Storage Networking Industry Association has an entire industry accepted performance test specification for solid state storage devices. Some of the tests are complicated to perform, but they allow us to look at some important performance metrics in a standard, objective way.
Click to enlarge!
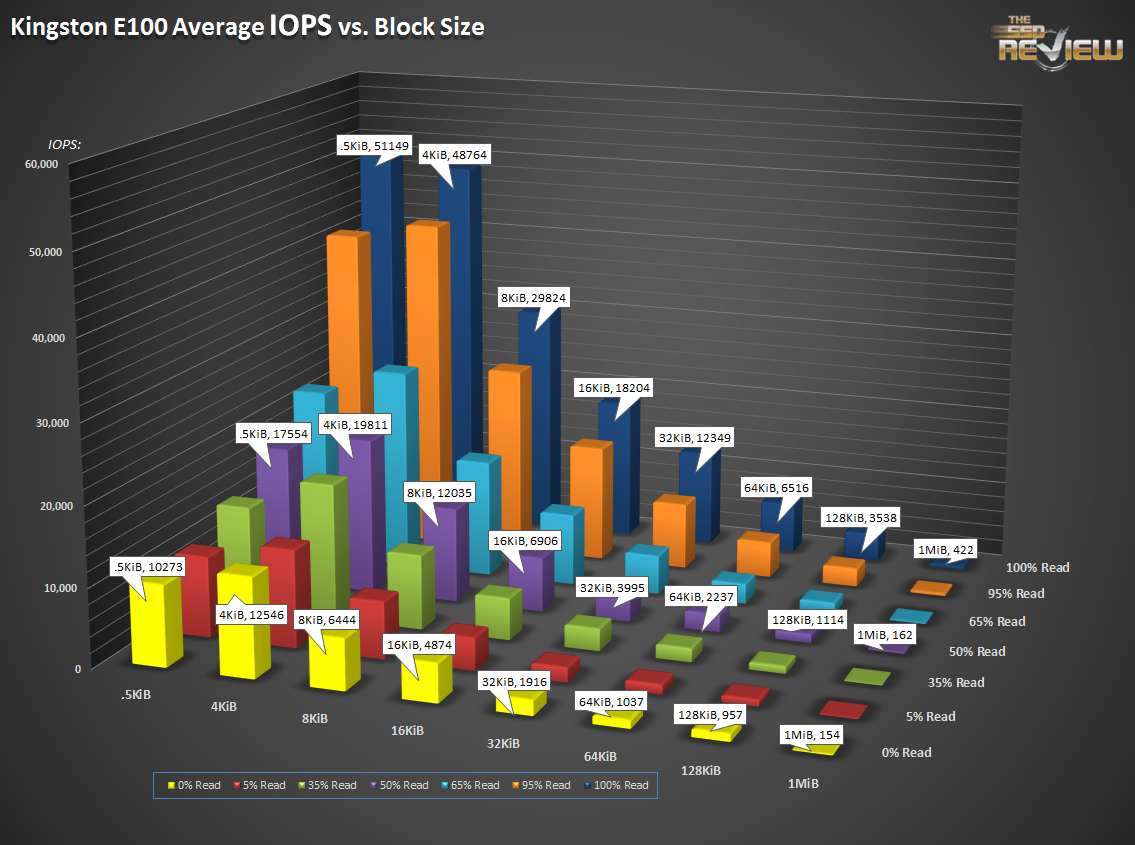
SNIA’s performance test specifications include IOPS testing, but it’s not quite what you’re expecting. It’s composed of 25 rounds of testing, each round taking 56 minutes to complete. We measure IOPS at 8 different block sizes (512 bytes through 1 MB) at 7 different read/write mixes. From 100% read to 0% read (that’s 100% write) and five more mixes in between. Once the 25 rounds are finished (at just under 24 hours), we evaluate the average performance of four of the 25 rounds once steady state is achieved. We can look at the resulting data in different ways, but the column chart you see above is a great indicator of performance.
You can take a closer look at the above graph by clicking on it; 100% read is at the top, 100% write is at the bottom. Block sizes increase from 512 bytes on the left to 1MB on the right. It’s a lot to take in, but the results of this one test can predict the way the drive performs in nearly every other test.
- Preconditioning: 2x capacity fill with 128K sequential writes
- Each round is composed of .5K, 4K, 8K, 16K, 32K, 64K, 128K, and 1MB accesses
- Each access size is run at 100%, 95%, 65%, 50%, 35%, 5%, and 0% Read/Write Mixes, each for one minute.
- The test is composed of 25 rounds (one round takes 56 minutes, 25 rounds = 1,400 minutes)
Through 23.3 hours of testing, the E100’s column chart looks much like other SandForce drives. If you click on the above chart and blow it up, notice that by the rounds which compose this test, 4K 0% read/100% writes are up to 12,000 IOPS.
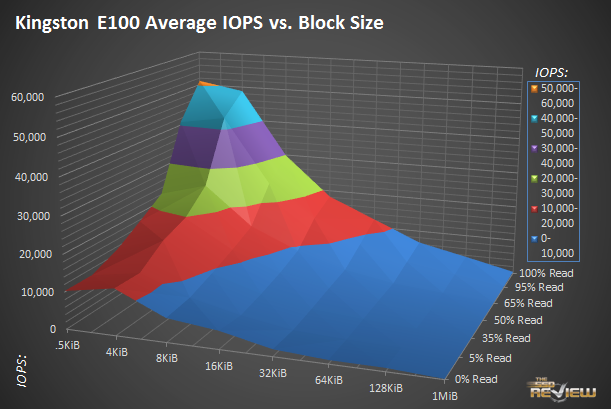
This is the same chart as above, but rendered in a surface chart and not a column. It’s great for getting a feel for strengths and weaknesses, and for nearly all drives, reads are prominent. Going towards the back-left corner, IOPS increase. Head towards the bottom right, and IOPS diminish greatly. If we were to show this graph in terms of MB/s and not IOPS though, it would look much flatter.
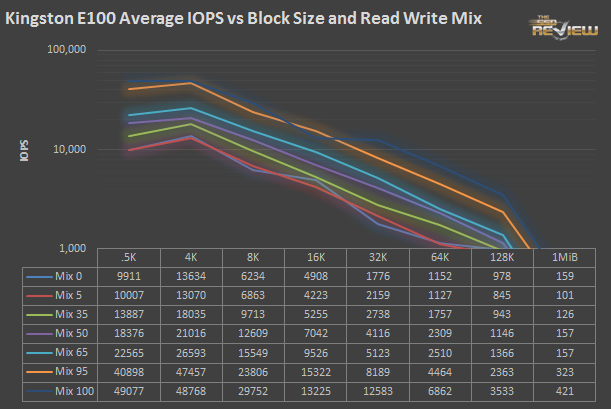
If you were wondering what one round looks like, here is the last one, round 25. Each of the 56 individual tests are listed here.
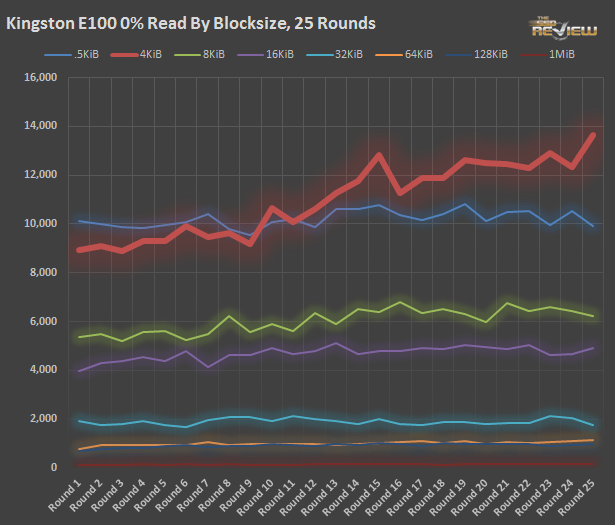
The IOPS loop workload is complex and repeating, yielding interesting results for different drives. This chart is all of the 0% read/100% write tests for each of the 25 rounds.
After the 128K preconditioning write, the E100 finds itself in quite a hole. Eventually, as SandForce’s garbage collection mojo does its work at write time, the hole starts to get progressively more shallow. Most drives actually resemble the exact opposite of this chart, but the E100 struggles for its life, cleaning up the drive as it goes, resulting in higher performance over time.
The 4K write in the above chart is highlighted in the thick, red line at the top. It begins its journey almost exactly where the write saturation testing ends, but makes it to nearly 14,000 IOPS before the ride is over. Were we to continue the test for another day, the Kingston would eventually get itself to an equilibrium. The implication is that if your workload is composed of mixed read/write mixes and block sizes, the LSI SF-2582 can keep average performance well above worse case scenarios.