
CRYSTAL DISK BENCHMARK VER. 0.0 X64
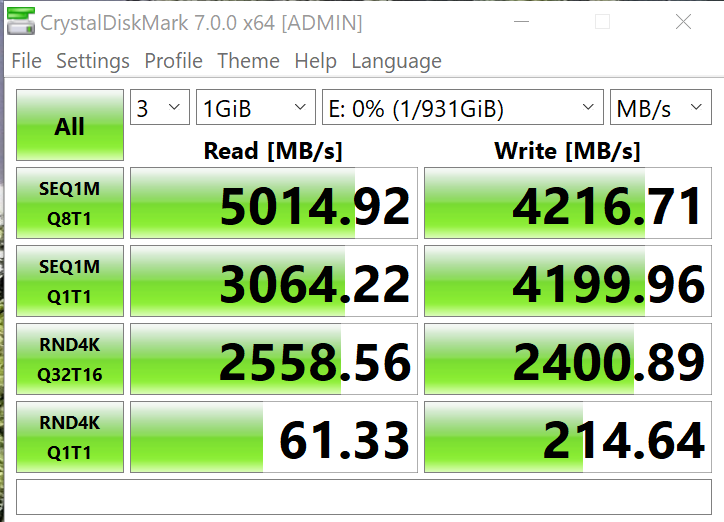
Crystal Disk Benchmark is used to measure read and write performance through sampling of random data which is, for the most part, incompressible. Performance is virtually identical, regardless of data sample so we have included only that using random data samples.
THROUGHPUT
IOPS
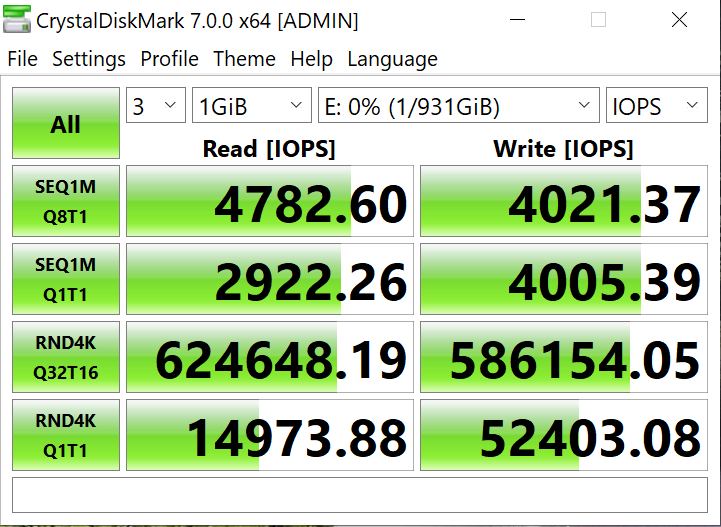
Very strong performance is shown with throughput and IOPS results are also decent with read and write well over 1/2 million.
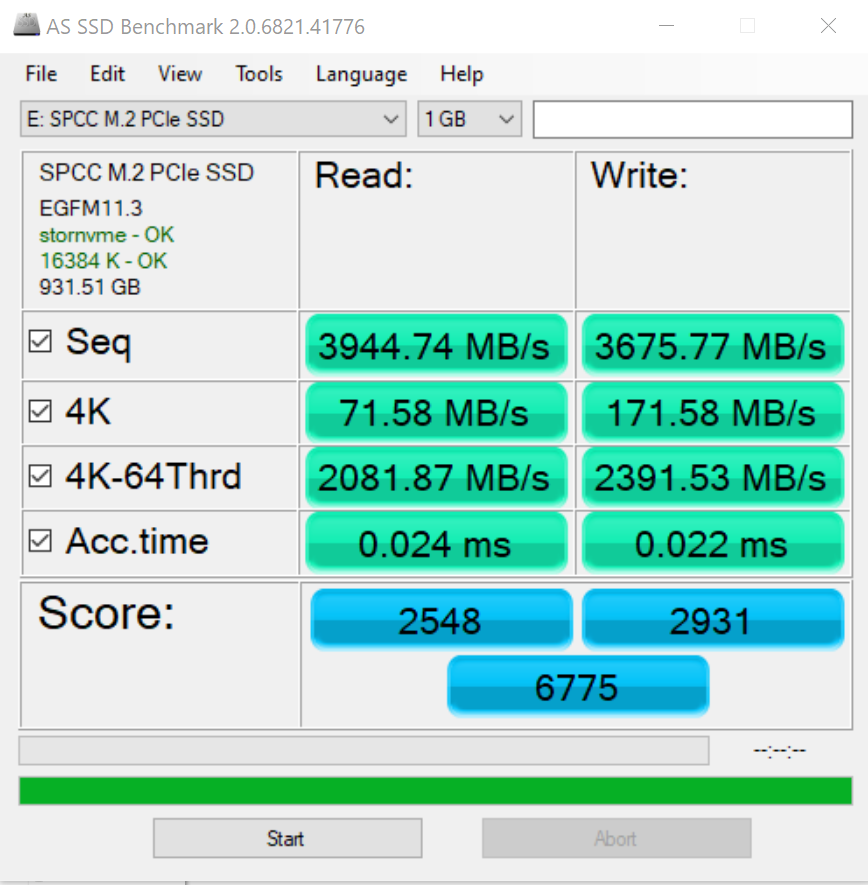
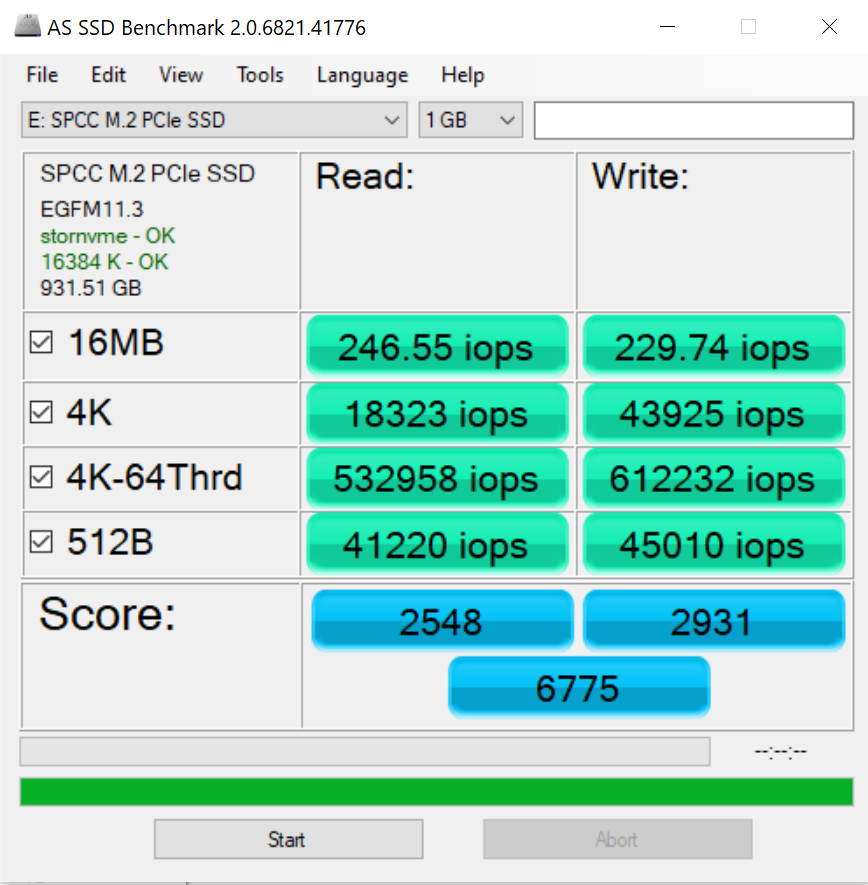
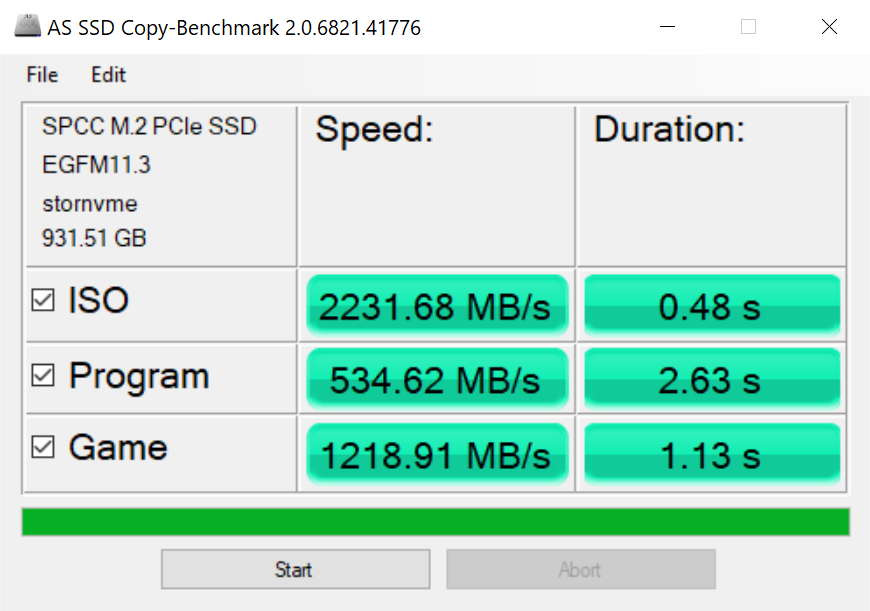
The toughest benchmark available for solid state drives is AS SSD as it relies solely on incompressible data samples when testing performance. For the most part, AS SSD tests can be considered the ‘worst case scenario’ in obtaining data transfer speeds and many enthusiasts like AS SSD for their needs. Transfer speeds are displayed on the left with IOPS results on the right.The AS SSD results aren’t as appealing as we might like to see but do get a first look at read and write IOPS which appear to be in the general ball park of listed specs.
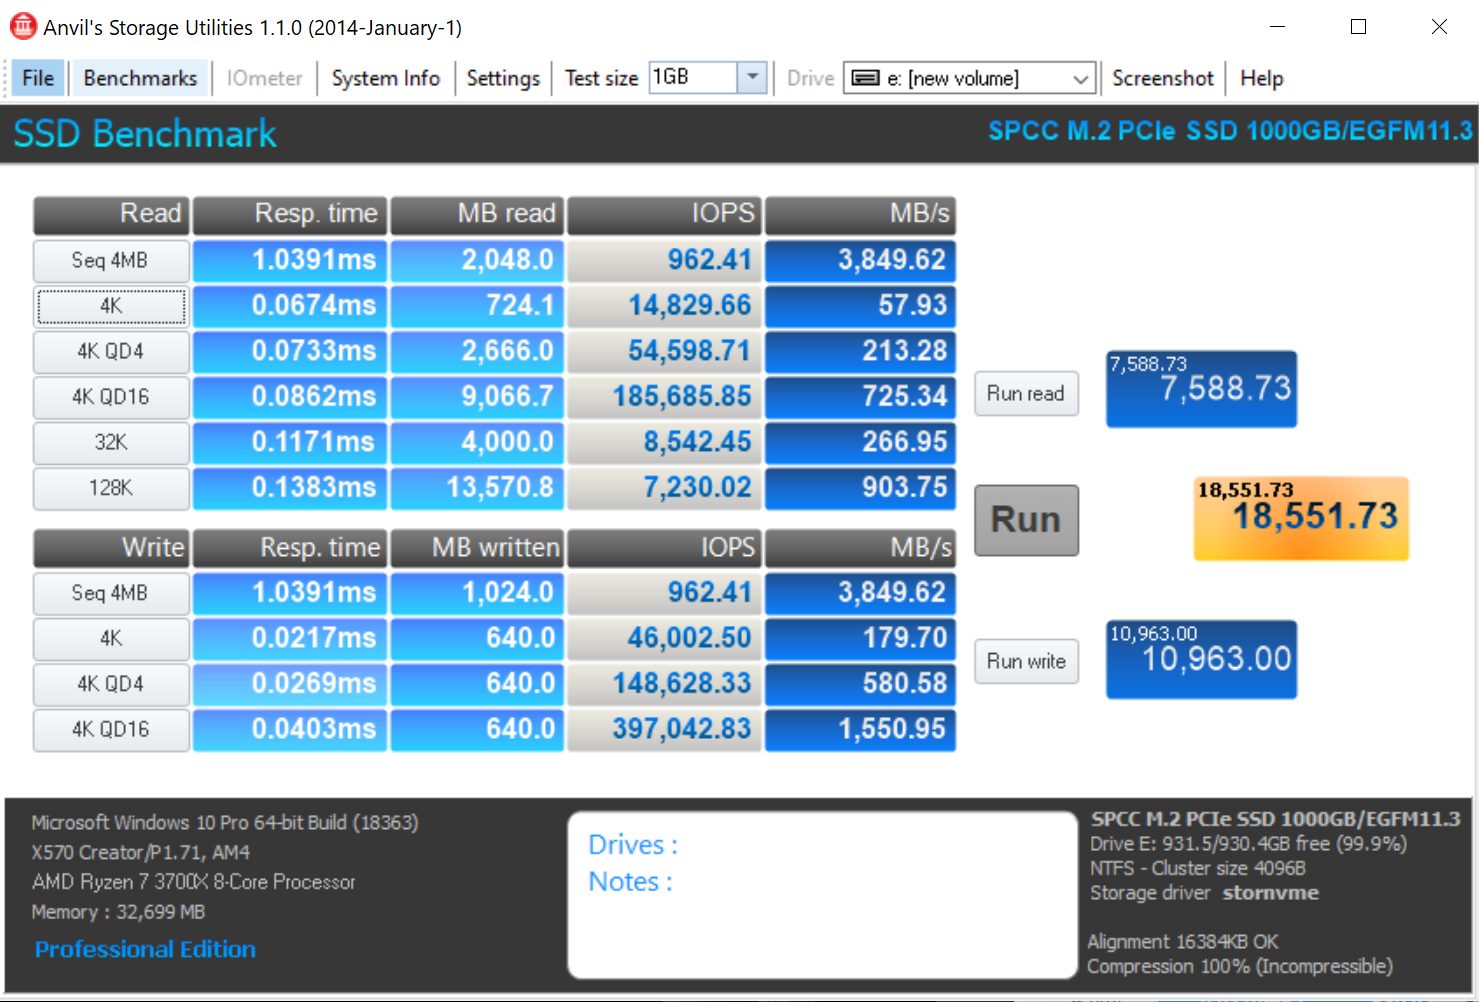
ANVIL STORAGE UTILITIES PROFESSIONAL
Anvil’s Storage Utilities (ASU) are the most complete test bed available for the solid state drive today. The benchmark displays test results for, not only throughput but also, IOPS and Disk Access Times. Not only does it have a preset SSD benchmark, but also, it has included such things as endurance testing and threaded I/O read, write and mixed tests, all of which are very simple to understand and use in our benchmark testing.
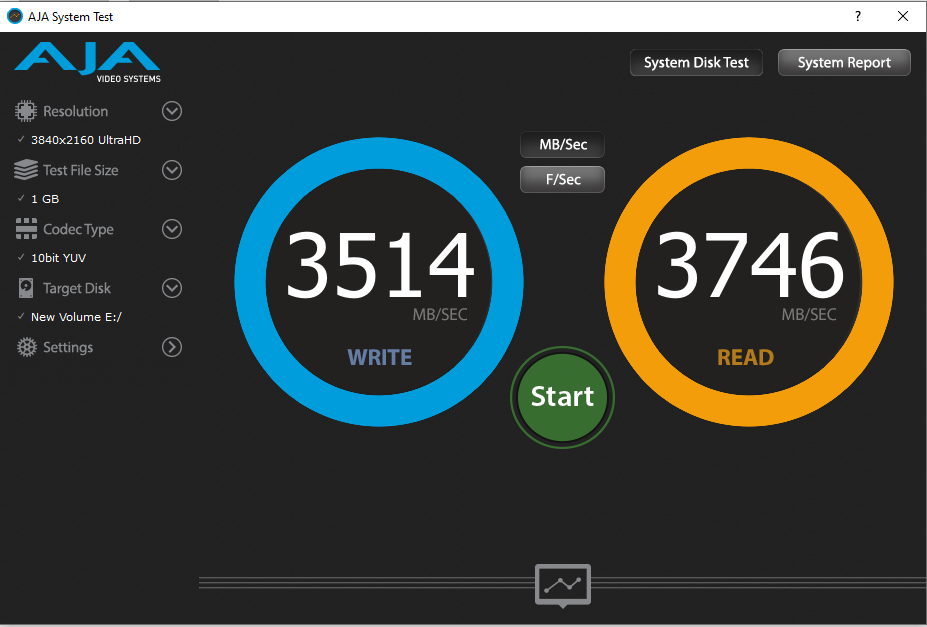
The AJA Video Systems Disk Test is relatively new to our testing and tests the transfer speed of video files with different resolutions and Codec.
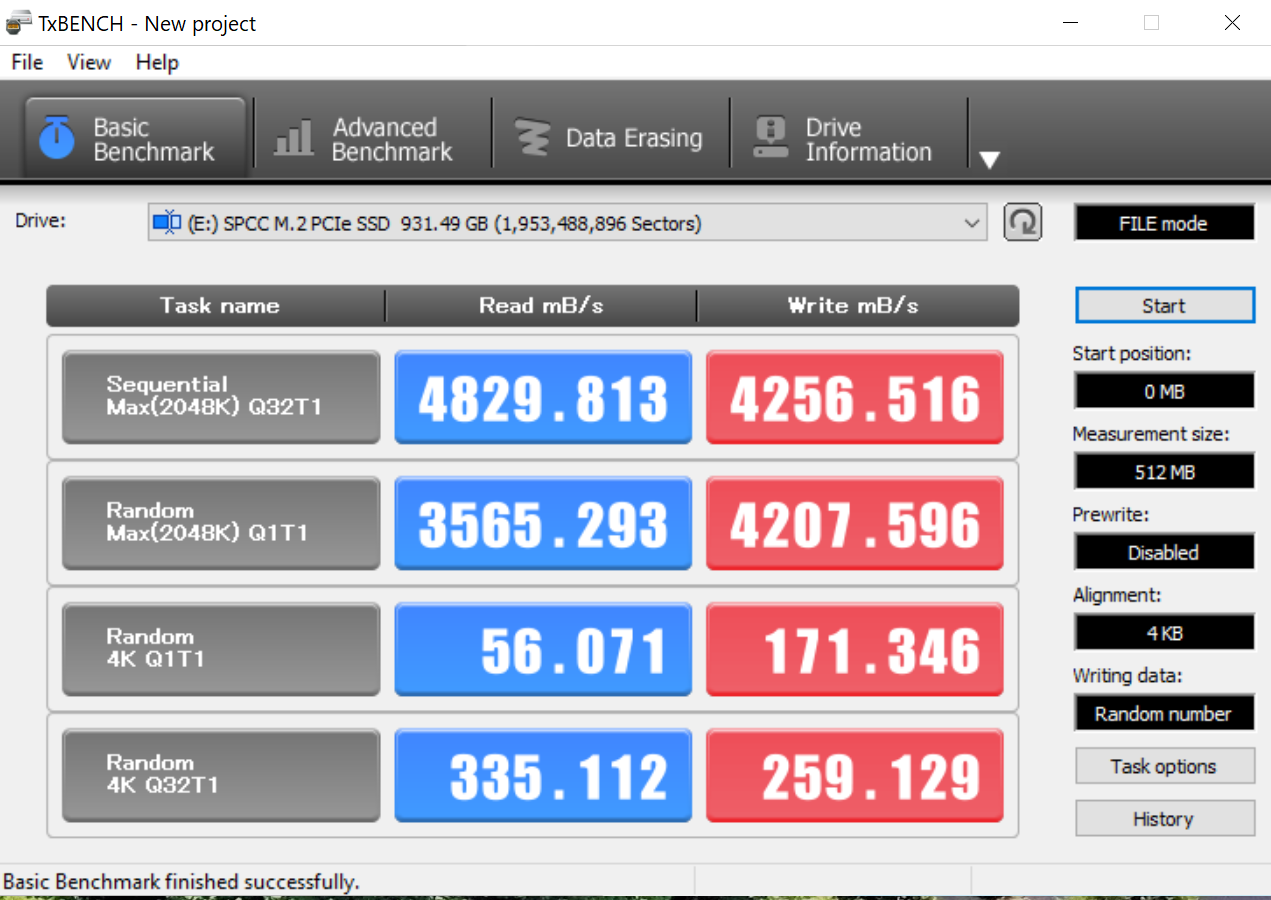
TxBench is one of our newly discovered benchmarks that we works much the same as Crystal Diskmark, but with several other features. Advanced load bench-marking can be configured, as well as full drive information and data erasing via secure erase, enhanced secure erase, TRIM and overwriting. Simply click on the title for a free copy.
The SSD Review uses PCMark 8’s Storage test suite to create testing scenarios that might be used in the typical user experience. With 10 traces recorded from Adobe Creative Suite, Microsoft Office and a selection of popular games, it covers some of the most popular light to heavy workloads. Unlike synthetic storage tests, the PCMark 8 Storage benchmark highlights real-world performance differences between storage devices. After an initial break-in cycle and three rounds of the testing, we are given a file score and bandwidth amount. The higher the score/bandwidth, the better the drive performs.
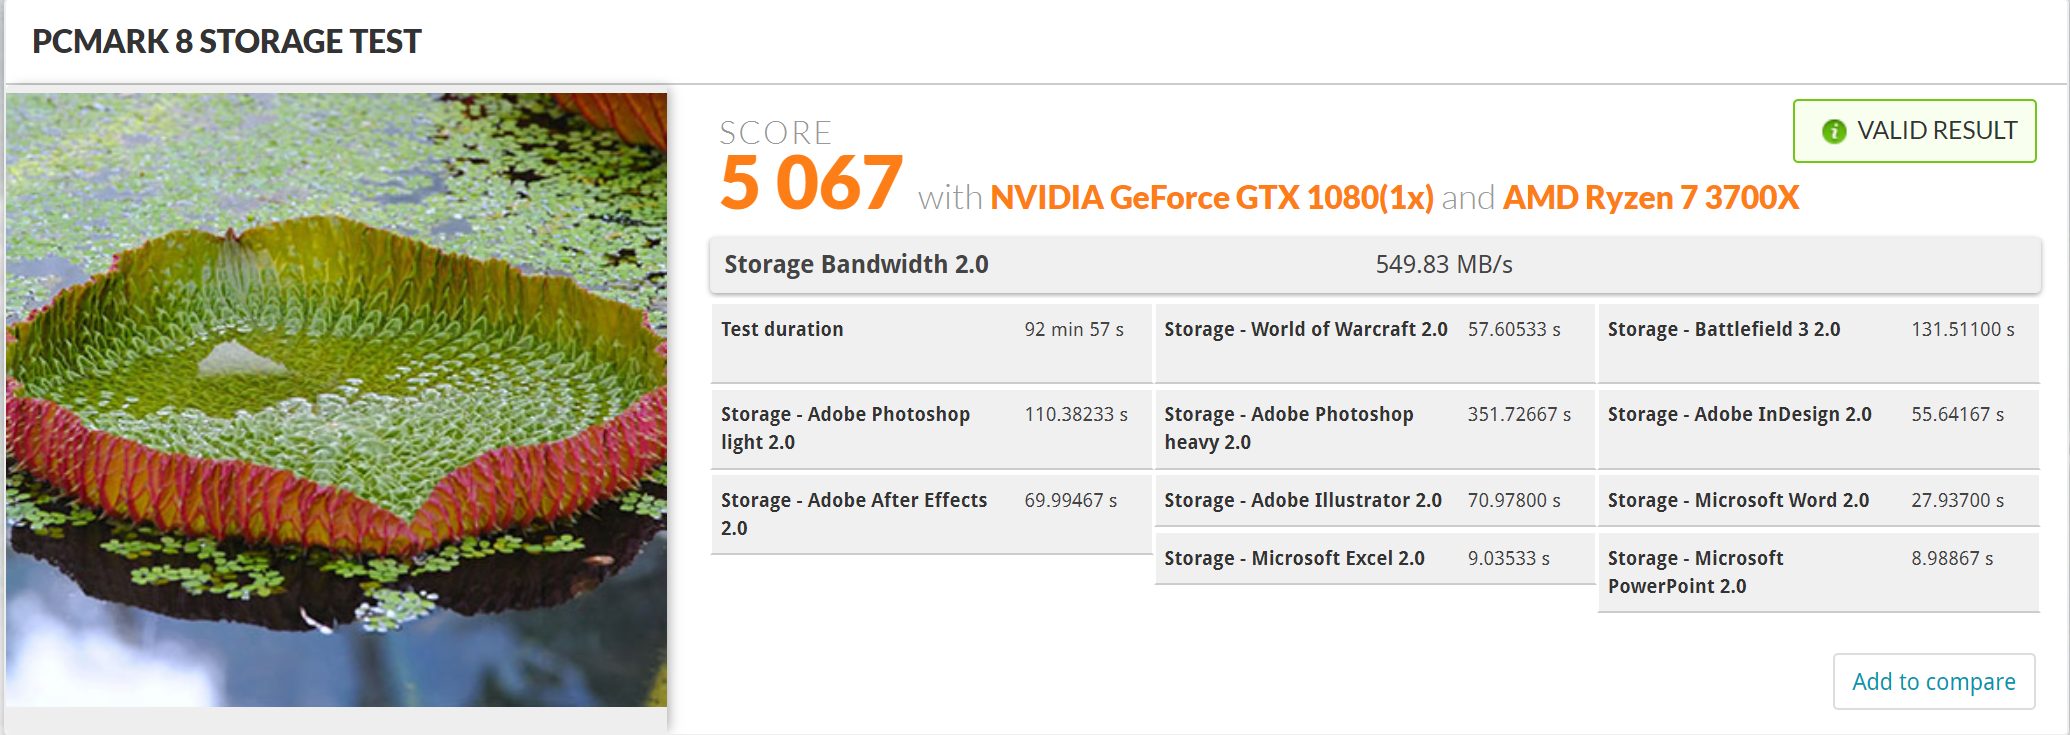
A bit lower than expected and we are going to call it a compatibility issue, which happens with different benchmark programs from time to time. We should be seeing number similar to the Seagate 520 at 667MB/s or the Corsair MP600 at 707MB/s. We reran this test several times with the same result.