
REAL WORLD FILE TRANSFER COMPARISON
For our file transfer comparison, included storage media consisted of the Intel SSD 900P, Kingston DCP1000 1.6TB NVMe Data Center SSD, Samsung 960 Pro 2TB NVMe M.2 SSD, WD Black HDD with Intel Optane Memory (32GB), OWC Mercury Electra 2TB SATA 3 SSD, and the Western Digital Black HDD alone. Our data samples consisted of 15GB folders of video, music, photos and operating system and all movement was simply copying from one folder to another on the drive.
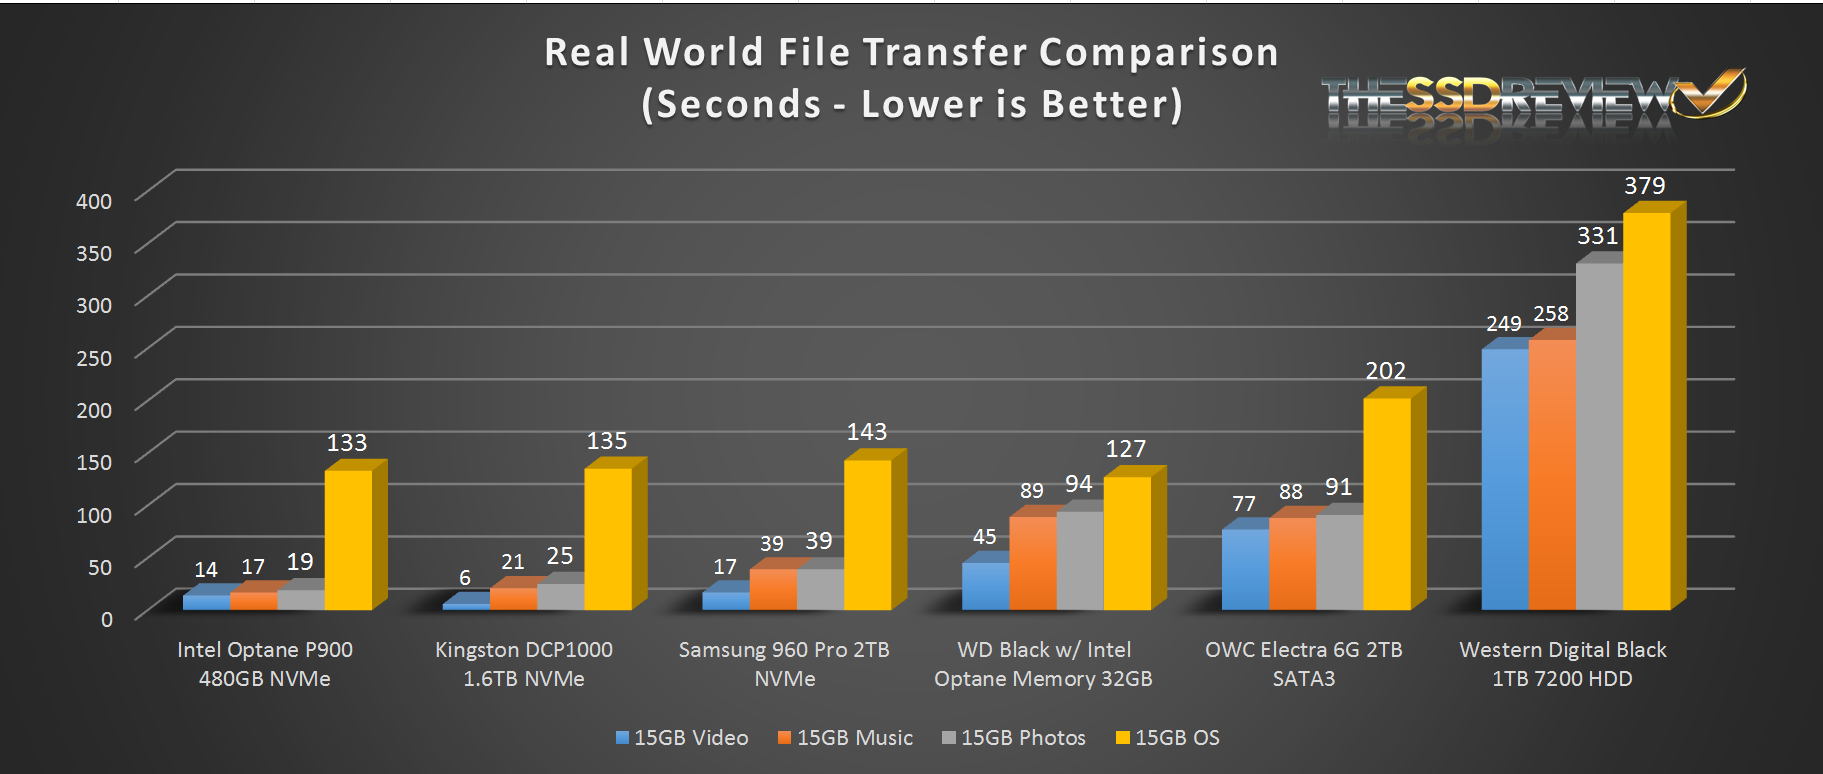
As much as these results were expected for the most part, we were still surprised that the Optane SSD 900P returned better data transfer times than the Kingston DCP 1000 enterprise SSD when transferring music, photos and OS files. For this specific test, we have yet to see another storage medium top these results.
The SSD Review uses PCMark 8’s Storage test suite to create testing scenarios that might be used in the typical user experience. With 10 traces recorded from Adobe Creative Suite, Microsoft Office and a selection of popular games, it covers some of the most popular light to heavy workloads. Unlike synthetic storage tests, the PCMark 8 Storage benchmark highlights real-world performance differences between storage devices. After an initial break-in cycle and three rounds of the testing, we are given a file score and bandwidth amount. The higher the score/bandwidth, the better the drive performs.
PCMARK 8 STORAGE RESULTS
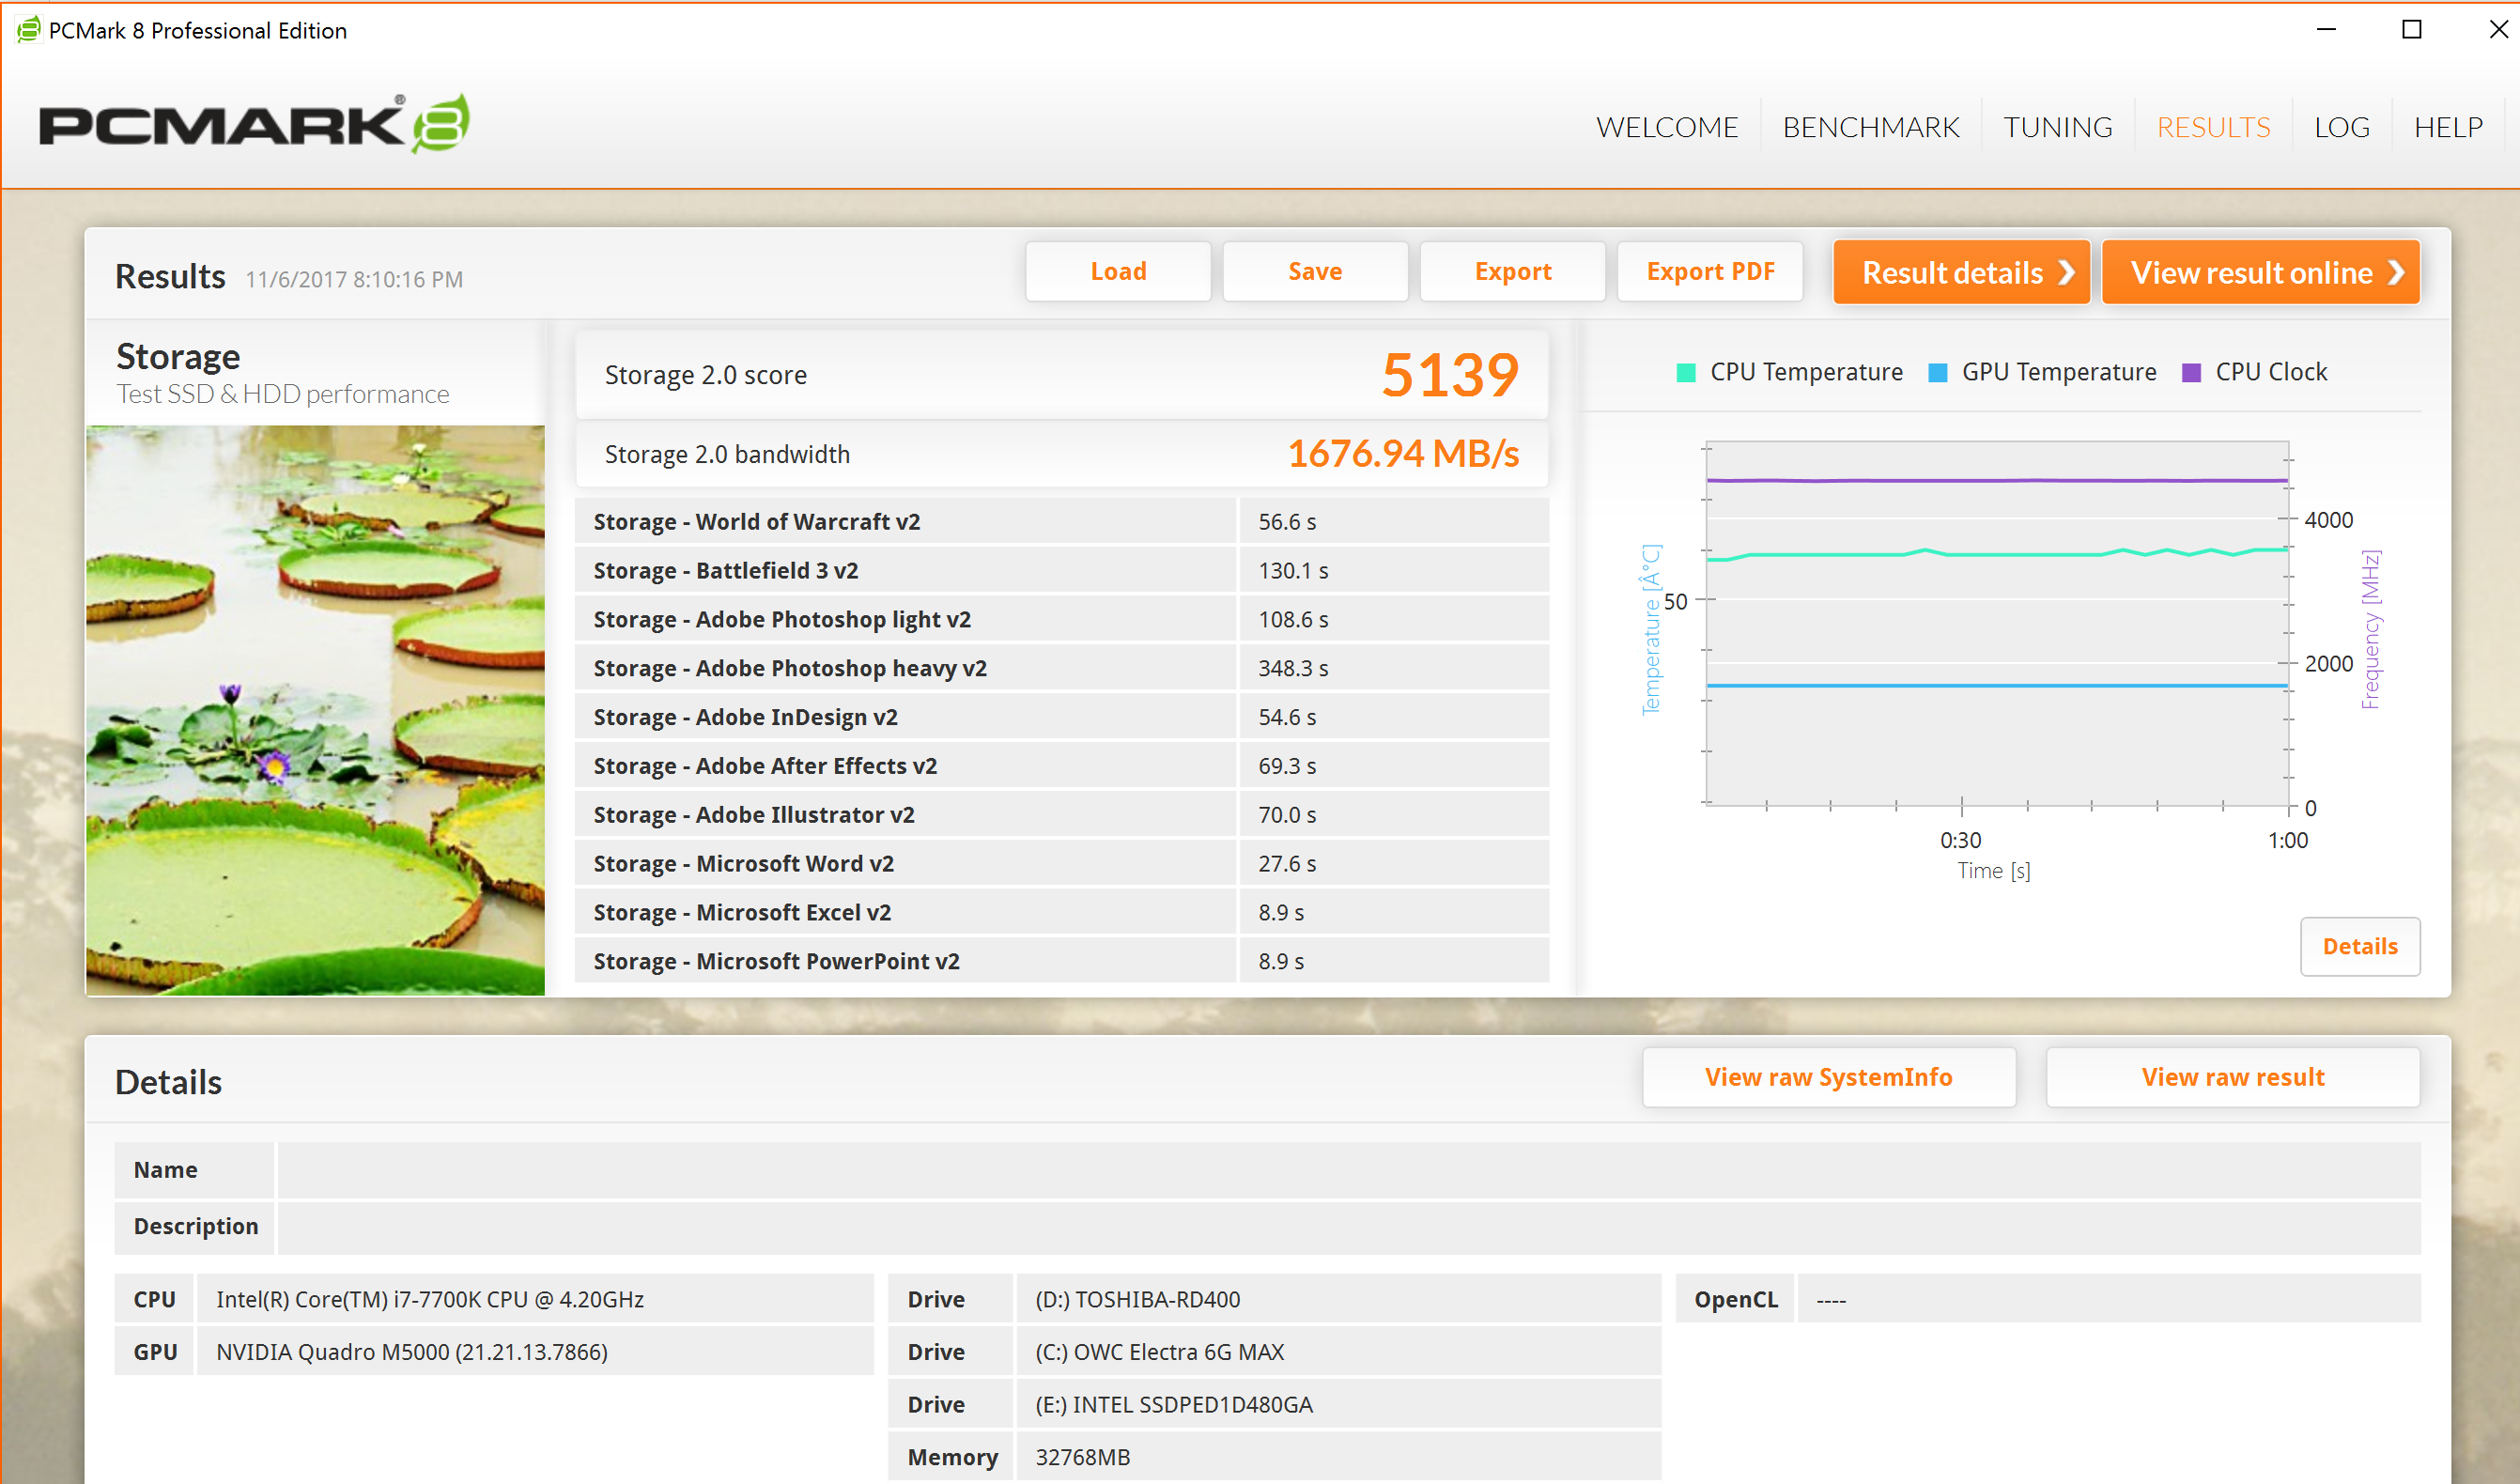
In PCMark 8 the Intel Optane SSD 900P scored 5139 points and averaged 1676.94MB/s in bandwidth.
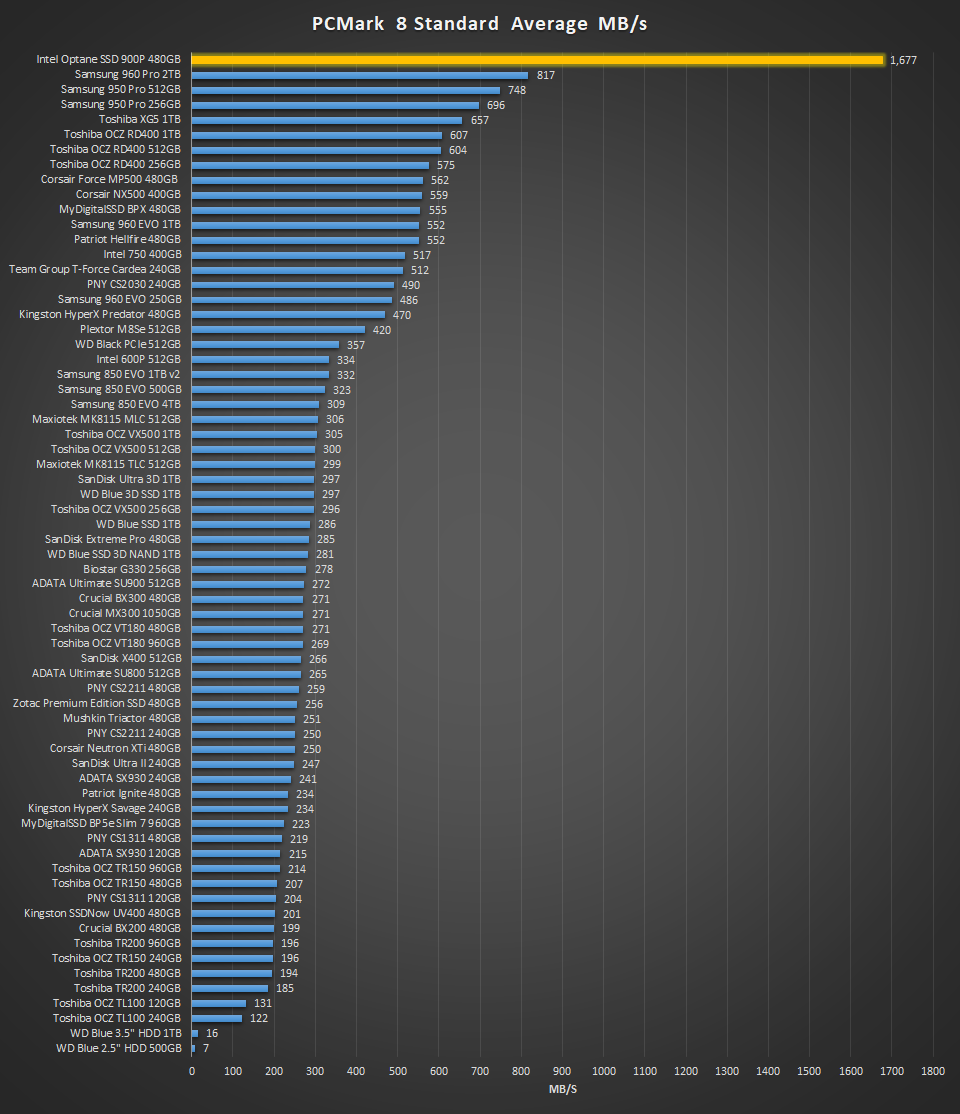
Once again, the Intel Optane SSD 900P blows the competition out of the water. The second highest result ever achieved was with the Samsung 960Pro 2TB NVMe SSD which reached a high of 817MB/s.
PCMARK 8 EXTENDED STORAGE WORKLOAD CONSISTENCY TESTING
For our last benchmark, we have decided to use PCMark 8 Extended Storage Workload in order to determine steady state throughput of the SSD. This software is the longest in our battery of tests and takes just under 18 hours per SSD. As this is a specialized component of PCMark 8 Professional, its final result is void of any colorful graphs or charts typical of the normal online results and deciphering the resulting excel file into an easily understood result takes several more hours.
There are 18 phases of testing throughout the entire run, 8 runs of the Degradation Phase, 5 runs of the Steady State Phase and 5 runs of the Recovery Phase. In each phase, several performance tests are run of 10 different software programs; Adobe After Effects, Illustrator, InDesign, Photoshop Heavy and Photoshop Light, Microsoft Excel, PowerPoint and Word, as well as Battlefield 3 and World of Warcraft to cover the gaming element.
- PRECONDITIONING -The entire SSD is filled twice sequentially with random data of a 128KB file size. The second run accounts for overprovisioning that would have escaped the first;
- DEGRADATION PHASE – The SSD is hit with random writes of between 4KB and 1MB for 10 minutes and then a single pass performance test is done of each application. The cycle is repeated 8 times, and with each time, the duration of random writes increases by 5 minutes;
- STEADY STATE PHASE – The drive is hit with random writes of between 4KB and 1MB for 45 minutes before each application is put through a performance test. This process is repeated 5 times;
- RECOVERY PHASE – The SSD is allowed to idle for 5 minutes before and between performance tests of all applications. This is repeated 5 times which accounts for garbage collection; and
- CLEANUP – The entire SSD is written with zero data at a write size of 128KB
In reading the results, the Degrade and Steady State phases represent heavy workload testing while the recovery phase represents typical consumer light workload testing.
As you can see, performance is recorded in terms of Bandwidth and Latency. Bandwidth (or throughput) represents the total throughput the drive is able to sustain during the tests during each phase. Latency, at least for the purposes of PCMark 8, takes on a different outlook and for this, we will term it ‘Total Storage Latency’. Typically, latency has been addressed as the time it takes for a command to be executed, or rather, the time from when the last command completed to the time that the next command started. This is shown below as ‘Average Latency’.
For a more in-depth look into Latency, Bandwidth, and IOPS check out our primer article on them here.
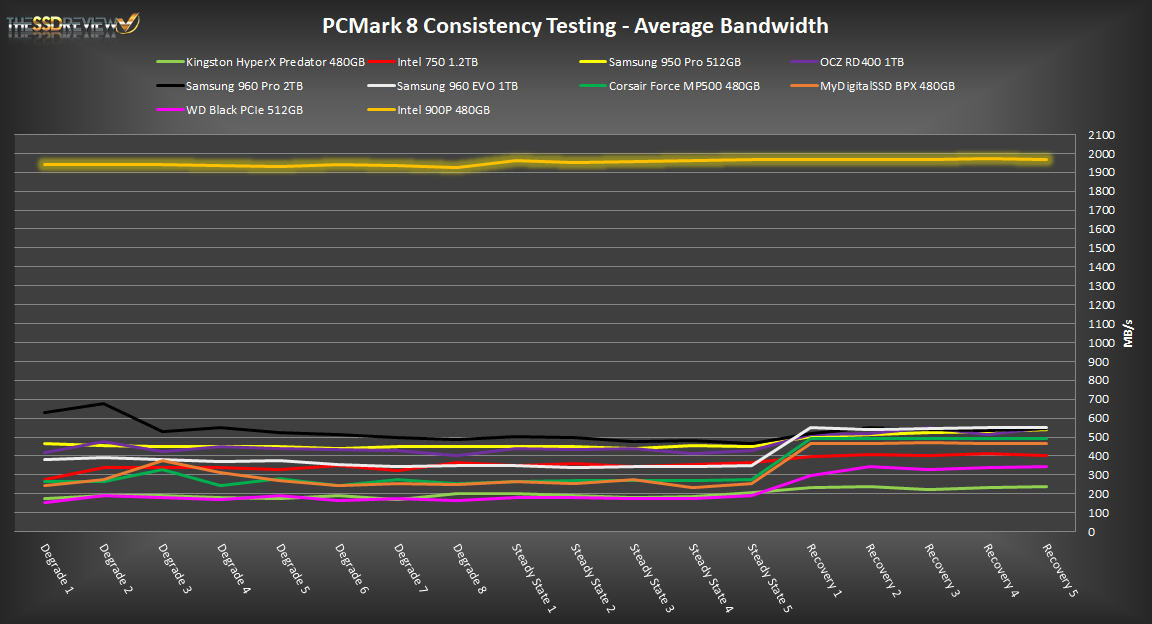
AVERAGE BANDWIDTH (OR THROUGHPUT)
These results show the total average bandwidth across all tests in the 18 phases. In this graph the higher the result the better.
AVERAGE LATENCY (OR ACCESS TIME)
These results show the average access time during the workloads across all tests in the 18 phases. In this graph the lower the result the better.
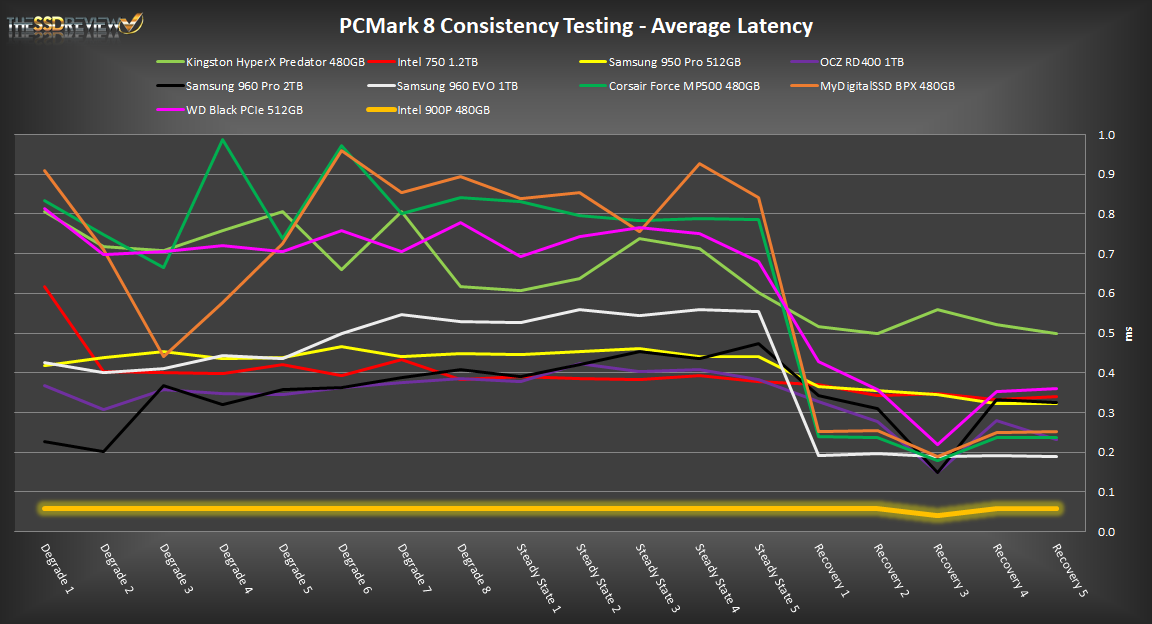
These results are probably the best available to demonstrate just how far ahead the Intel Optane SSD 900P is over all other SSDs. The test is by far the most grueling on any SSD, taking 13 hours plus to complete. To make this as simple as possible, the listed performance of SSDs is the performance acquired when the drive is brand new and before it has ever been used consistently. In more stressful settings (such as this test), the SSD will be pushed to steady state performance where it has no time to perform trim and garbage collection as it might normally do. Steady state results are much lower than that of specifications….but not for the Intel SSD 900P.
Reviewers haven’t quite got all the facts just yet as Intel is holding much close to the heart with 3D XPoint memory but, this memory isn’t subject to the normal performance degradation of a steady state environment. In fact, where all of our other tested drives dropped to below 600MB/s, the 900P remained steady at just below 2GB/s as shown in the first chart. Concurrently, the Intel Optane 900P latency is also much lower than that of the other drives which goes hand in hand with higher throughput.
How is the heatsink cover attached to the card? Is it possible to remove it without removing the heatsink from the pcb?
Yes it is simply clicked into place. It is very secure though.
awesome! many thanks for this analysis! Especially “REAL WORLD FILE TRANSFER COMPARISON” is great. Have seen this in no other place of optane reviews before. Only thing missing are some words reading boot speed in comparison to other fast but standard ssds (e.g. 960pro)
maybe you can also share some words on how does an optane drive feel in real life (workstation usage)?
Are things faster? E.g. windows file search? looking for windows updates? Sorting folders with 1000 files by date/size/name? Generating previews of images in folders which has not been opened (=cached) before? Virus check?
Thank you for the comps. I haven’t had it as a boot drive just yet so cannot comment on startup or general system activity. Look forward to getting to this in the future though…maybe as a follow up.
“by marketing a new flash”
No. It’s a new class of memory, not flash; those who have analysed it say it’s phase change memory (though Intel denies that).
https://www.techinsights.com/about-techinsights/overview/blog/intel-3D-xpoint-memory-die-removed-from-intel-optane-pcm/
Fair enough… In all honesty though, there still isn’t enough information available to exclude it from the flash category. Intel and Micron are very tight lipped.
Sure there is; it’s been verified as PCM/chalcogenide based:
https://www.techinsights.com/about-techinsights/overview/blog/intel-3D-xpoint-memory-die-removed-from-intel-optane-pcm/
https://www.pcper.com/reviews/Editorial/How-3D-XPoint-Phase-Change-Memory-Works
The theory is the secrecy is due to patents involving Energy Conversion Devices (ECD) which has been going through bankruptcy proceedings for years.
any news on micron’s Quantx ?
The Amazon link failed:
Your search “intel optane ssd 900p” did not match any products.
I’m in Oz.
Something I haven’t seen on these yet, I know the original Optane Cache was only supported by a few Intel chipsets. Is the 900p compatible with AMD platforms? Not seeing any compatibility documentation anywhere…
It’s a regular NVME drive like any other as far as your system is concerned.