
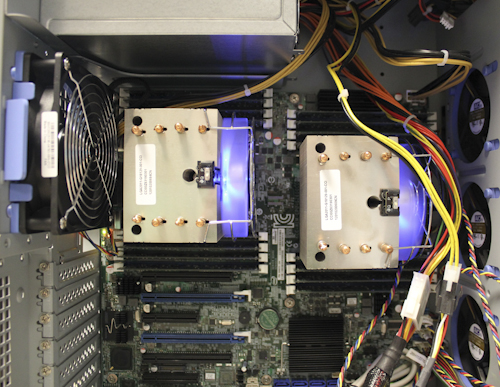
TEST BENCH AND PROTOCOL
 In testing the Kingston E50, along with all enterprise drives, we focus on long-term stability. In doing so, we stress products not only to their maximum rates, but also with workloads suited to enterprise environments.
We use many off-the-shelf tests to determine performance, but we also have specialized tests to explore specific behaviors we encounter. With enterprise drives, you will see that we do not focus on many consumer level use-cases.
Additionally, since the E50 utilizes compression, we make a point to stress the drive with both repeating (compressible) and random(incompressible) data, when applicable.
Our hope is that we present tangible results that provide relevant information to the buying public.
LATENCY
To specifically measure latency, we use a series of 512b, 4K, and 8K measurements. At each block size, latency is measured for 100% read, 65% read/35% write, and 100% write/0% read mixes.
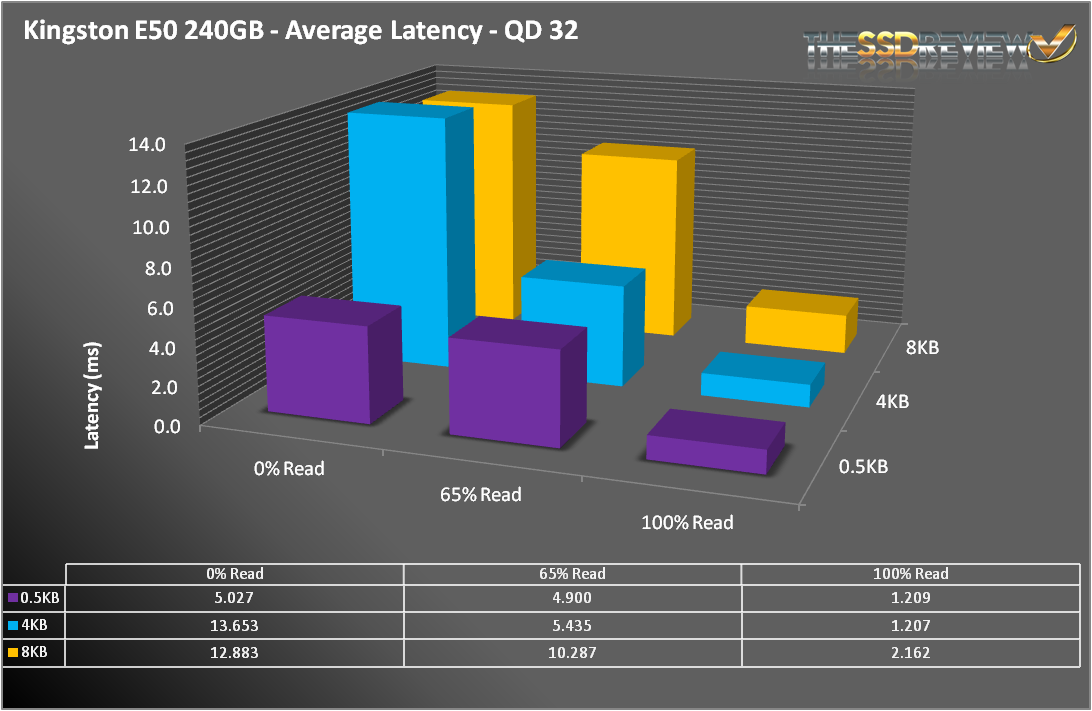
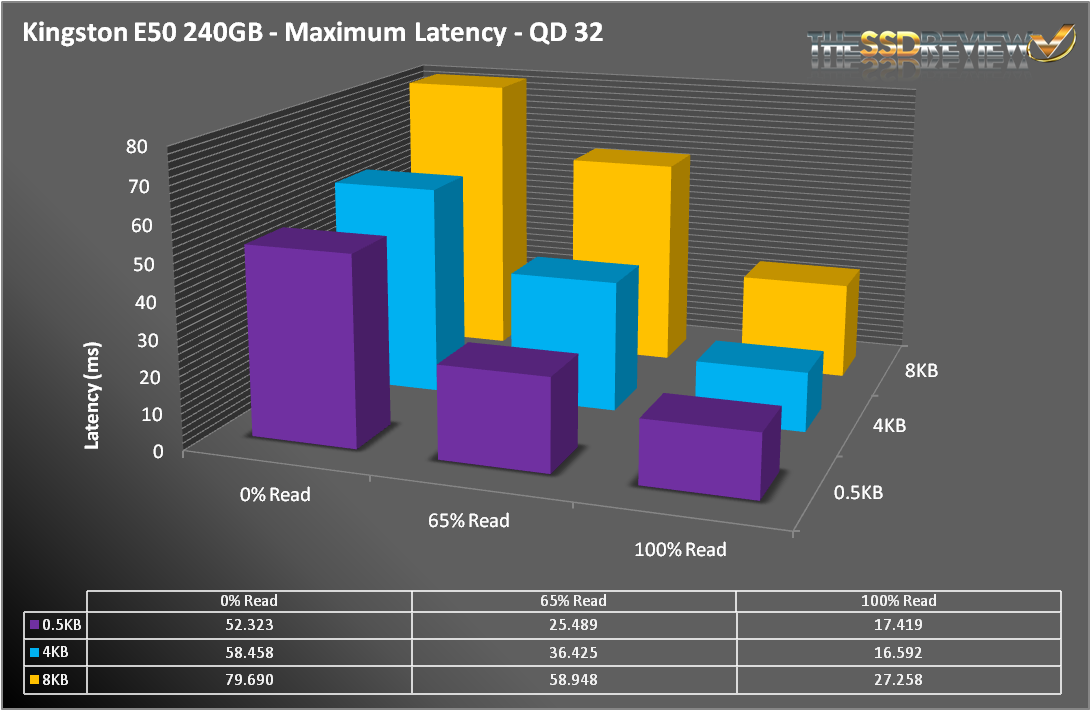
Our normal testing uses psuedo-random data, which should explain these results, but also gives an indication of what lies ahead. In this test, both the average and maximum latency observed was poor. In some cases, such as 4KB writes, the Intel S3500 SSD was nearly 6X better. The Intel S3500 isn’t exactly known as a random 4K workhorse, so these results are disheartening. Read operations weren’t much better, with the S3500 easily topping the E50.
To give the SSDNow E50 a fair shot, along with all LSI SandForce driven SSDs, we reran the testing with repeating data.
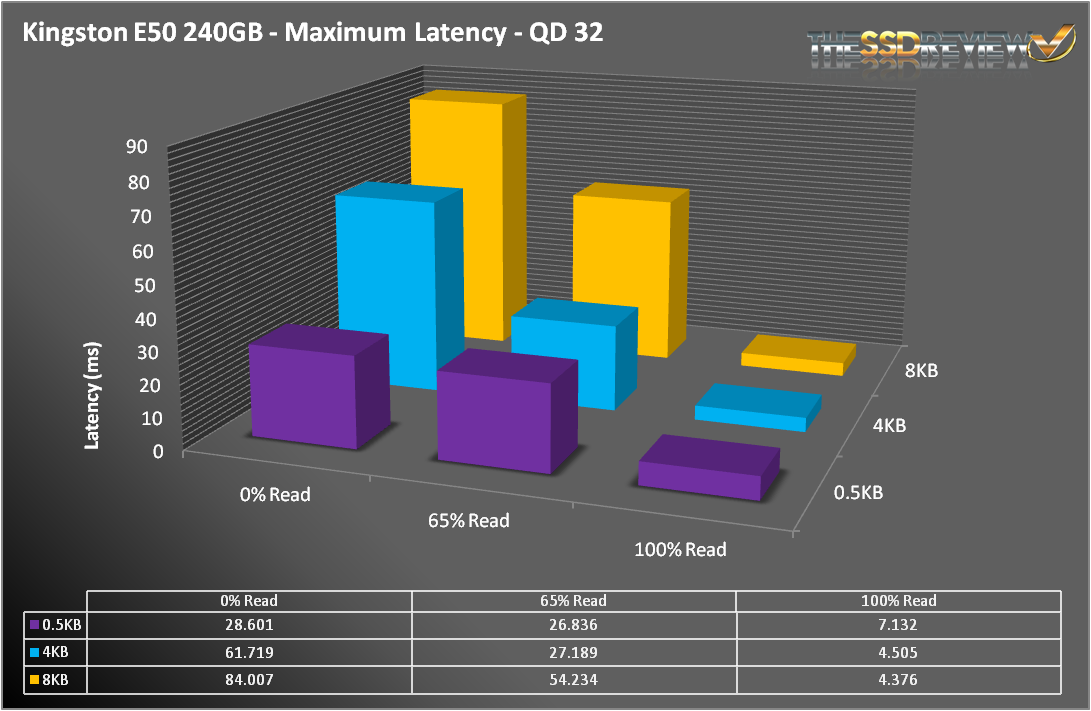
That’s more like it. The tables have turned on the S3500, with the E50 pulling ahead on 4KB writes by 2X. Unfortunately, reads still trail the S3500 by a considerable amount. Maximum response times also decreased, especially with read operations.
ADVANCED WRITE TESTING
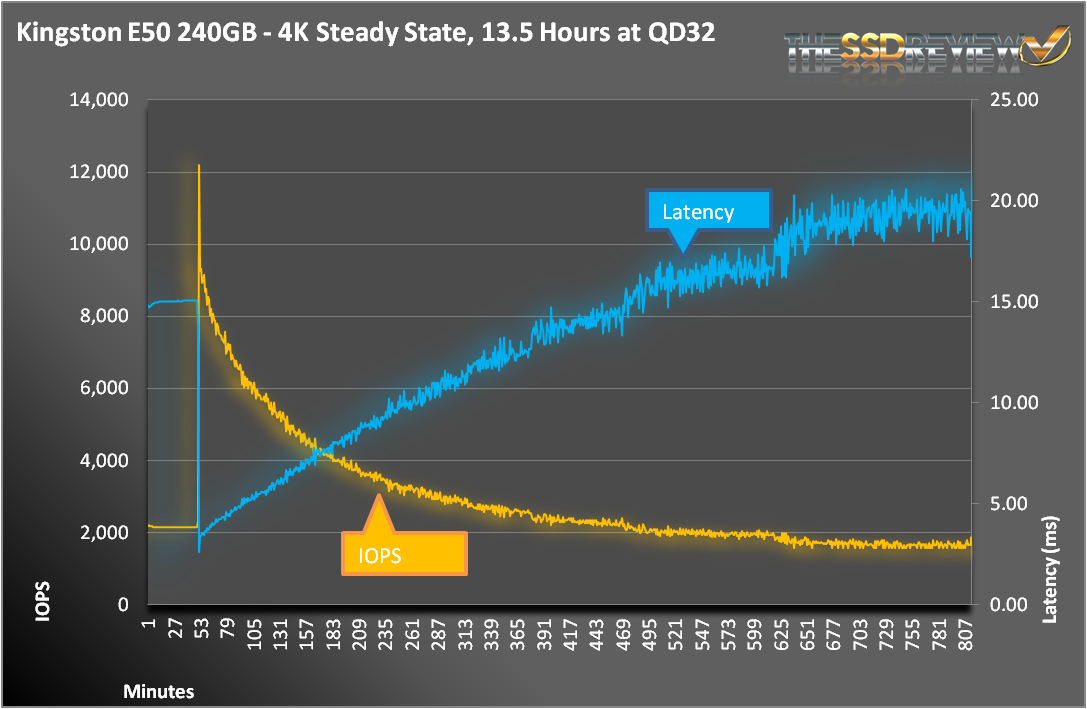
As we talked about in our Micron P400m SSD Review, SSDs have different performance states. Since the Kingston SSDNow E50 is an enterprise SSD, we will focus on steady state performance.
With the following tests, we stressed the drive using random 4KB write workloads across the entire span. Normally, we let the drive achieve stead-state before digging into the data and then look at the final 11 hours. With the E50 we observed some interesting results. After an hour, we saw what we thought was the transition from fresh-out-of-box to steady-state. After about 50 minutes of steady-state operation, the drive had a huge jump in performance followed by a long tail of performance degradation that took nearly 13 hours to complete. This occurred on a drive that was completely new and freshly opened. Performing secure erase and repeating the test gave us a more typical graph and we could not repeat the behavior.
Next, we zoomed in on the final hour to see the variability of the data at steady-state.
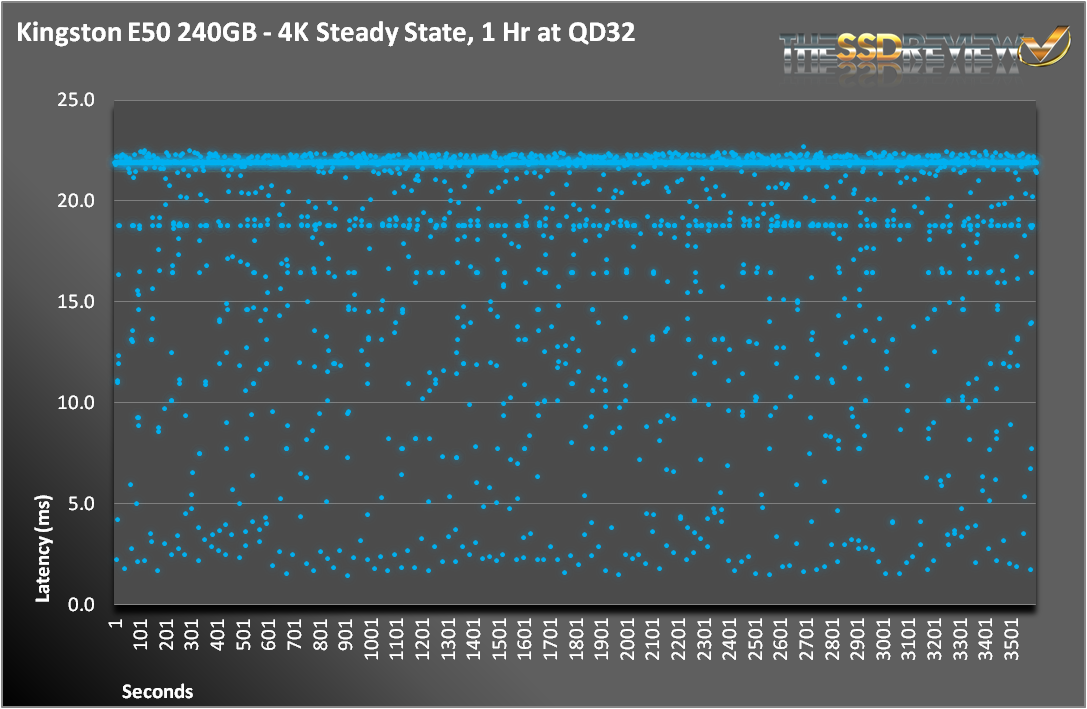
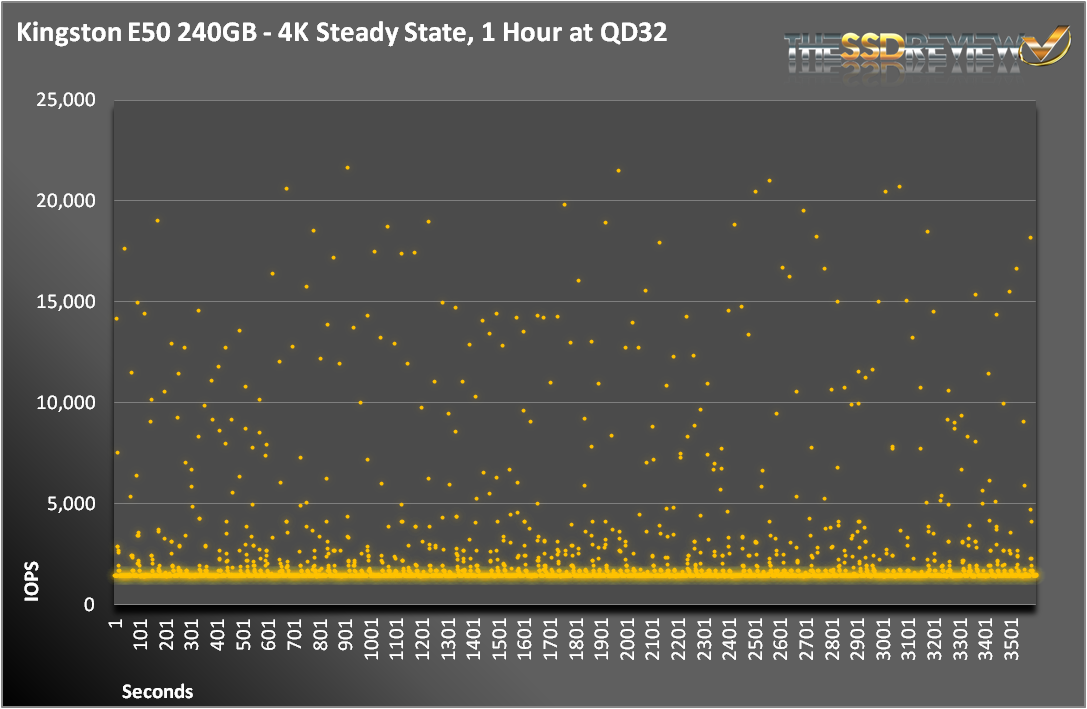
Because our test suite is only able to generate pseudo-random data, we were unable to test out what the latency looked like in the best case scenario. That’s too bad because as our previous results have indicated, the E50 does not handle random or pseudo-random write operations very well. In fact, the vast majority of our 1 second averages were above 20ms and below 2000 IOPS. Considering the E100 achieved less than 10K IOPS at steady-state, we weren’t too surprised with the results.
But what will the internal components be 6 months from now?
Hi, i did’nt understood the difference between the both SNIA’s test. The description of both is the same but the results are different. Thanks for attention.