

CRYSTAL DISK BENCHMARK VER. 5.5.0 X64
Crystal Disk Benchmark is used to measure read and write performance through sampling of random data which is, for the most part, incompressible. Performance is virtually identical, regardless of data sample so we have included only that using random data samples.
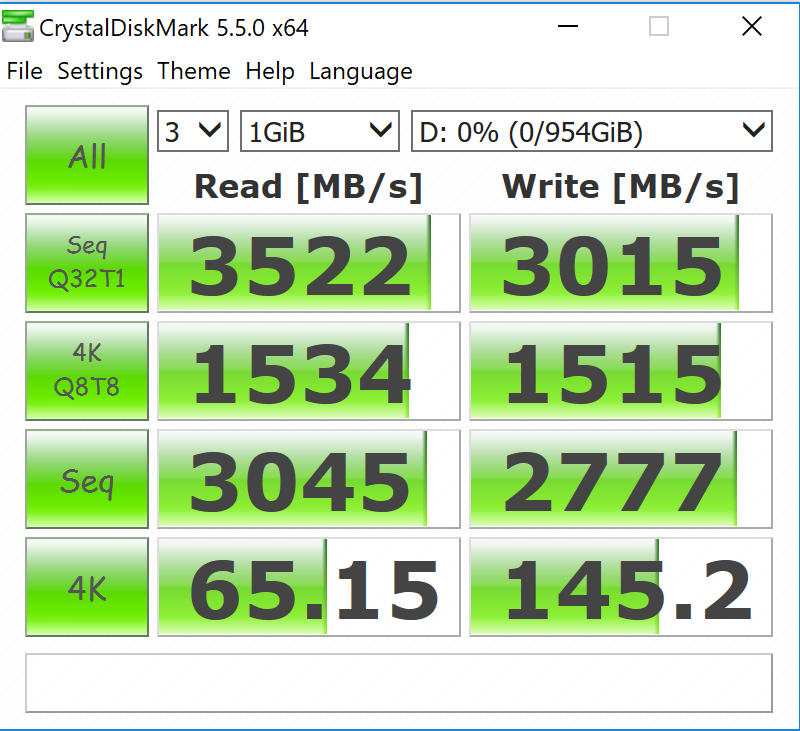
Listed specifications are hit dead on with 3.5GB/s read and 3GB/s write data throughput. In addition, the low 4K read performance of 65GB/s is something that we don’t typically see and is very high in comparison to the norm.
The toughest benchmark available for solid state drives is AS SSD as it relies solely on incompressible data samples when testing performance. For the most part, AS SSD tests can be considered the ‘worst case scenario’ in obtaining data transfer speeds and many enthusiasts like AS SSD for their needs. Transfer speeds are displayed on the left with IOPS results on the right.
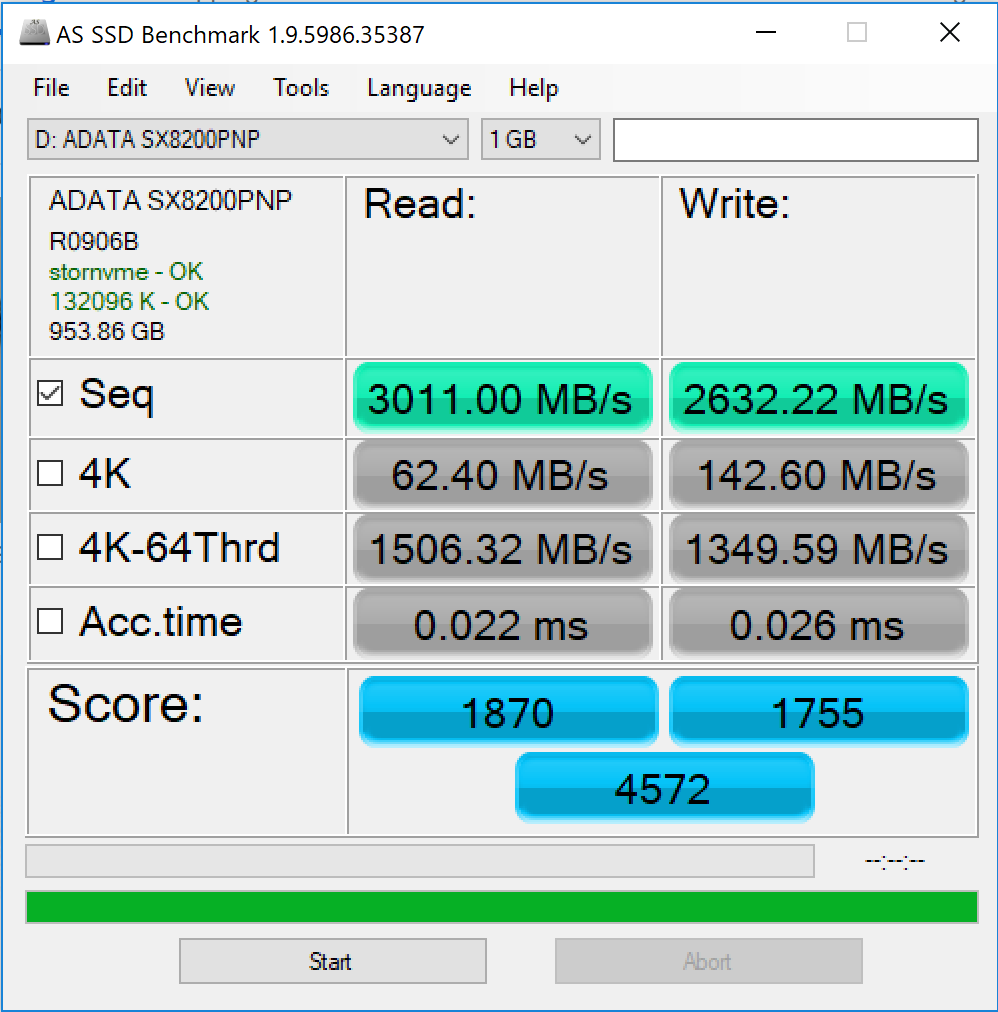
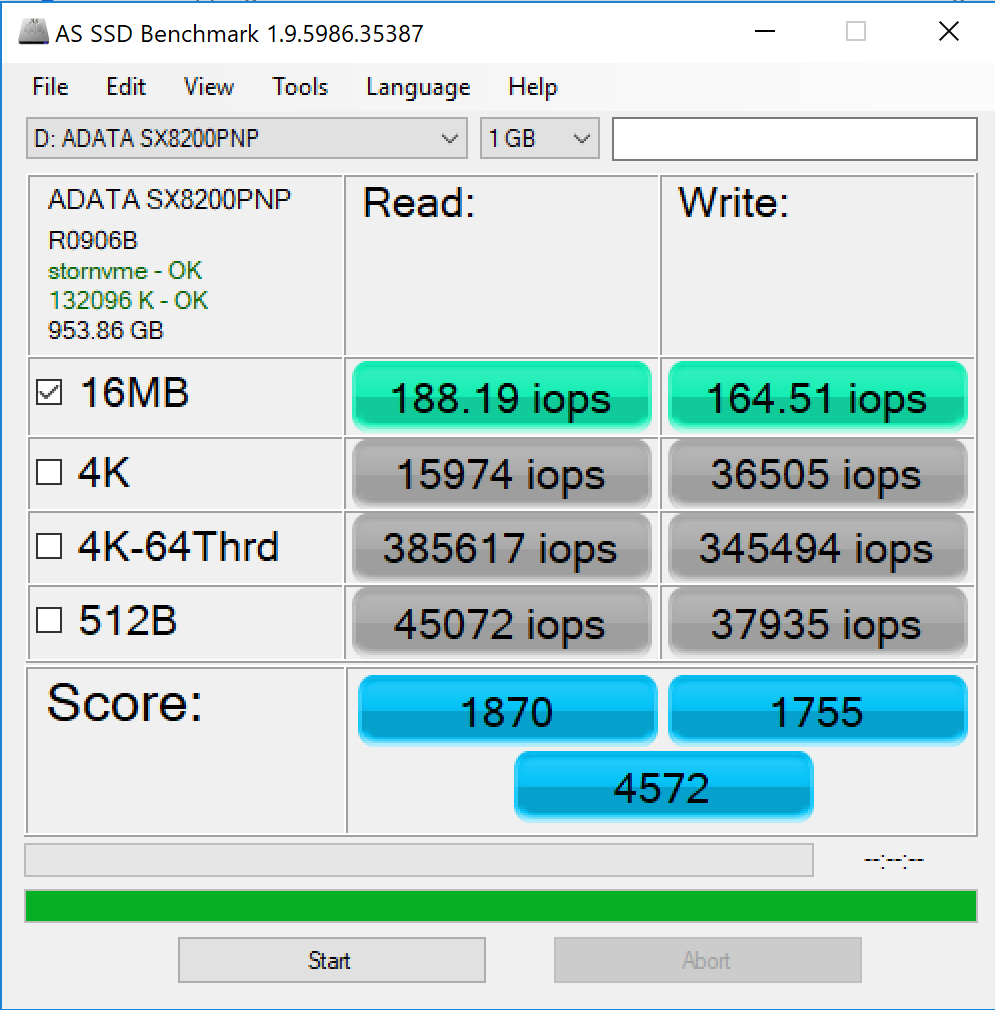
 The AS SSD results aren’t as appealing as we might like to see but do get a first look at read and write IOPS which appear to be in the general ball park of listed specs.
ANVIL STORAGE UTILITIES PROFESSIONAL
Anvil’s Storage Utilities (ASU) are the most complete test bed available for the solid state drive today. The benchmark displays test results for, not only throughput but also, IOPS and Disk Access Times. Not only does it have a preset SSD benchmark, but also, it has included such things as endurance testing and threaded I/O read, write and mixed tests, all of which are very simple to understand and use in our benchmark testing.
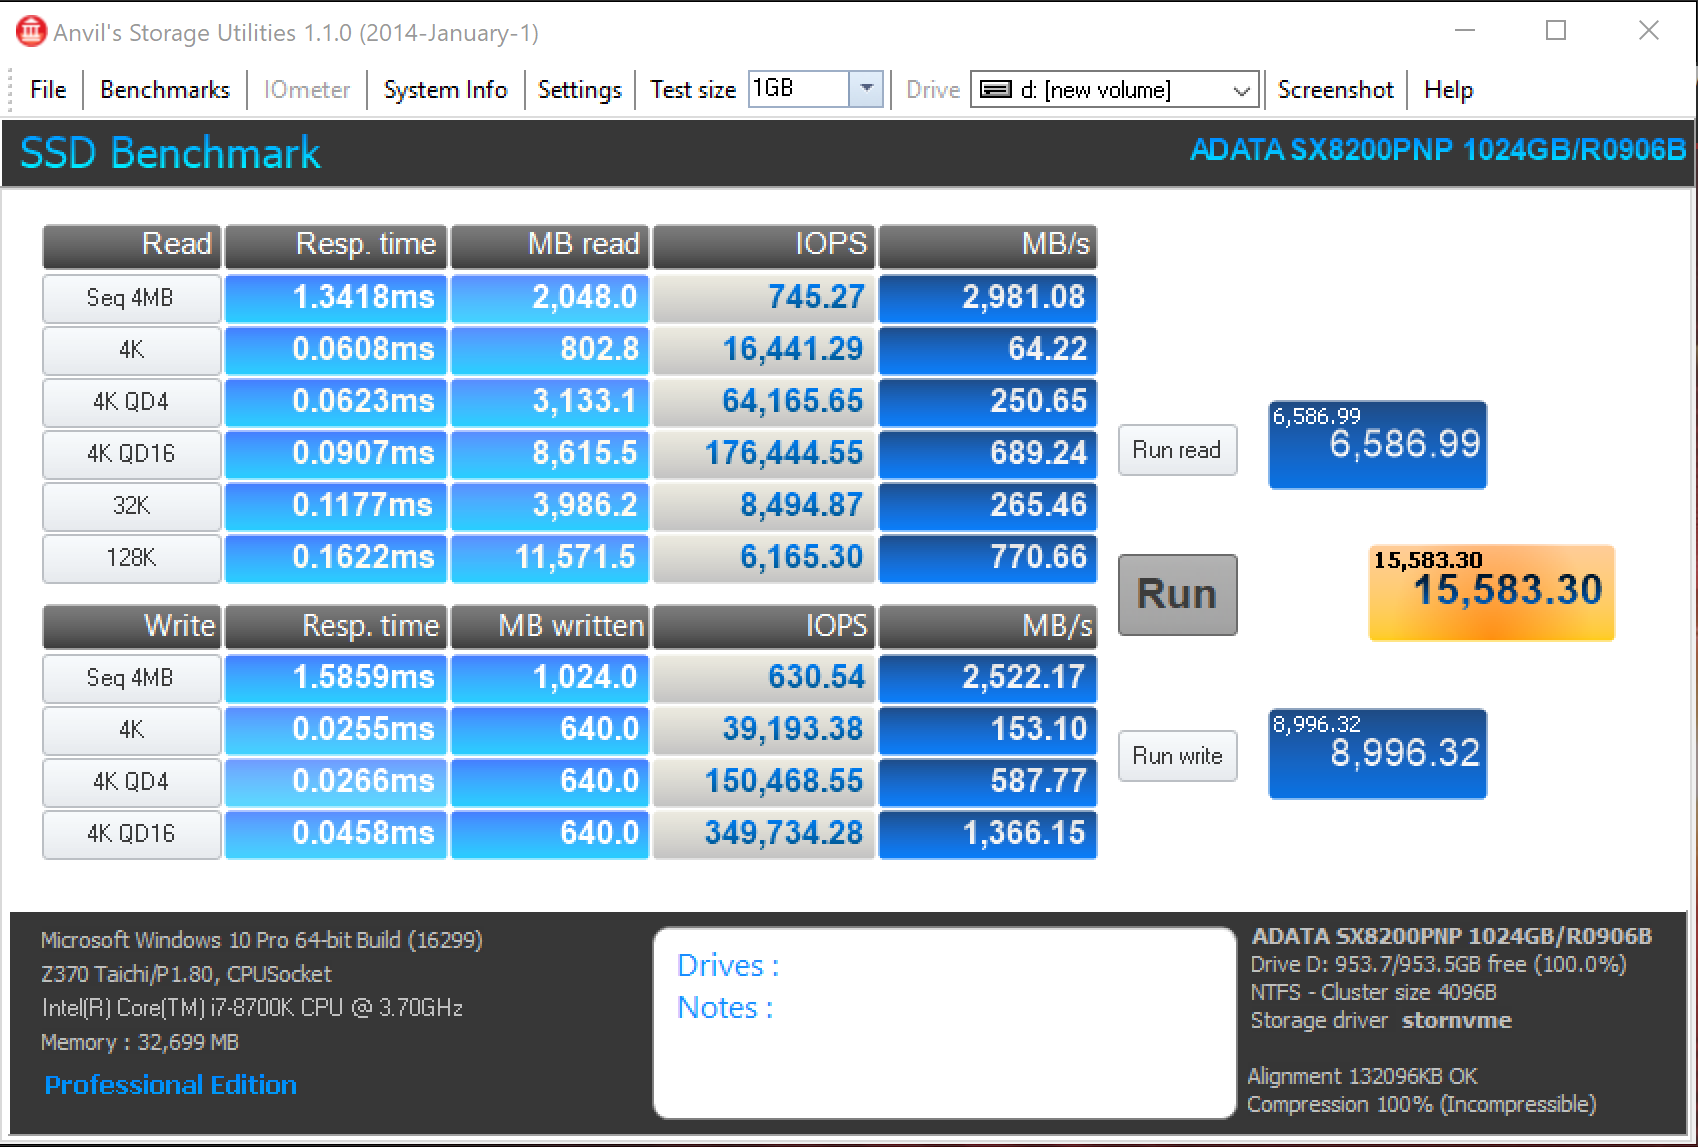
Once again, we are not overly impressed with the performance observed in Anvil, keeping in mind of course that this can always simply be a software issue where some controllers favor one benchmark and other favor another.
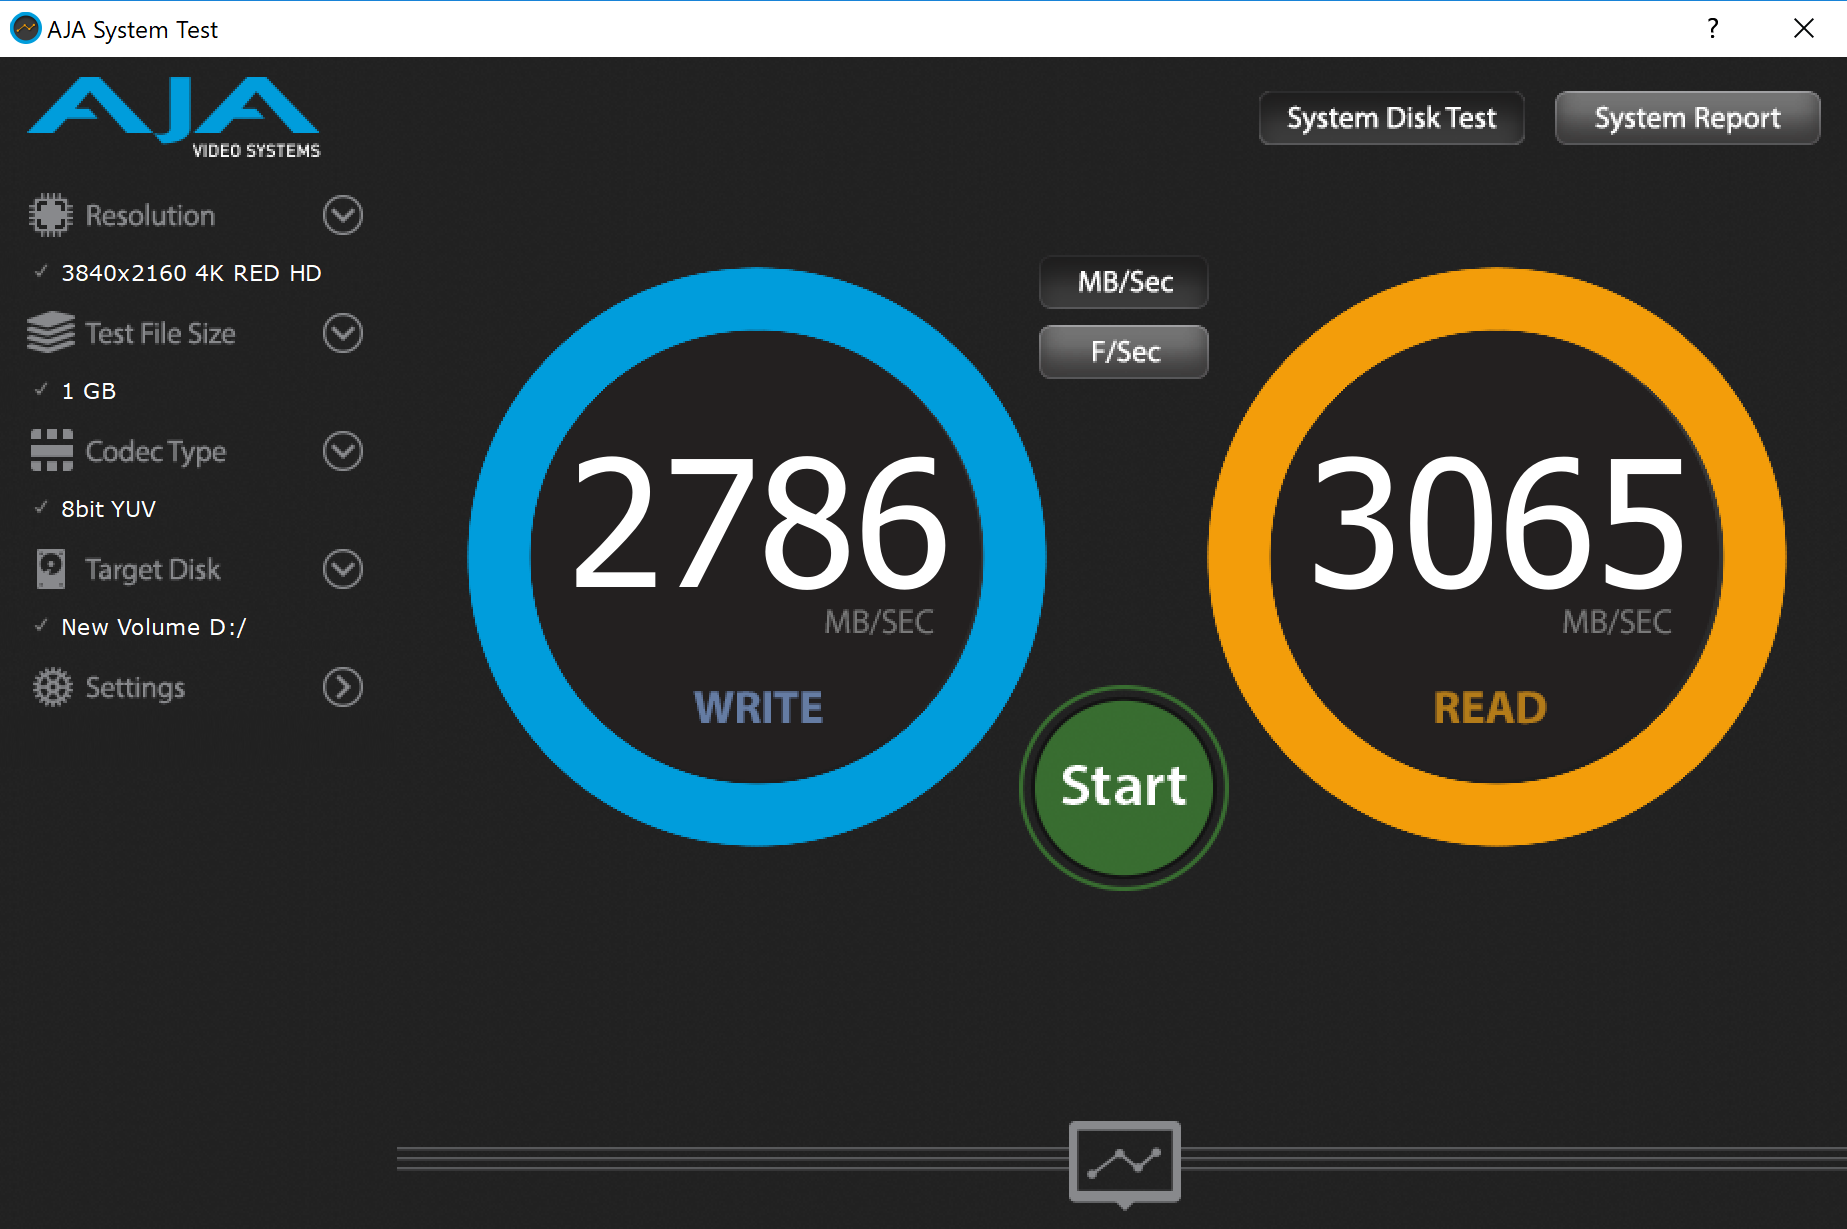
AJA VIDEO SYSTEM DISK TEST
The AJA Video Systems Disk Test is relatively new to our testing and tests the transfer speed of video files with different resolutions and Codec.
The SSD Review uses PCMark 8’s Storage test suite to create testing scenarios that might be used in the typical user experience. With 10 traces recorded from Adobe Creative Suite, Microsoft Office and a selection of popular games, it covers some of the most popular light to heavy workloads. Unlike synthetic storage tests, the PCMark 8 Storage benchmark highlights real-world performance differences between storage devices. After an initial break-in cycle and three rounds of the testing, we are given a file score and bandwidth amount. The higher the score/bandwidth, the better the drive performs.
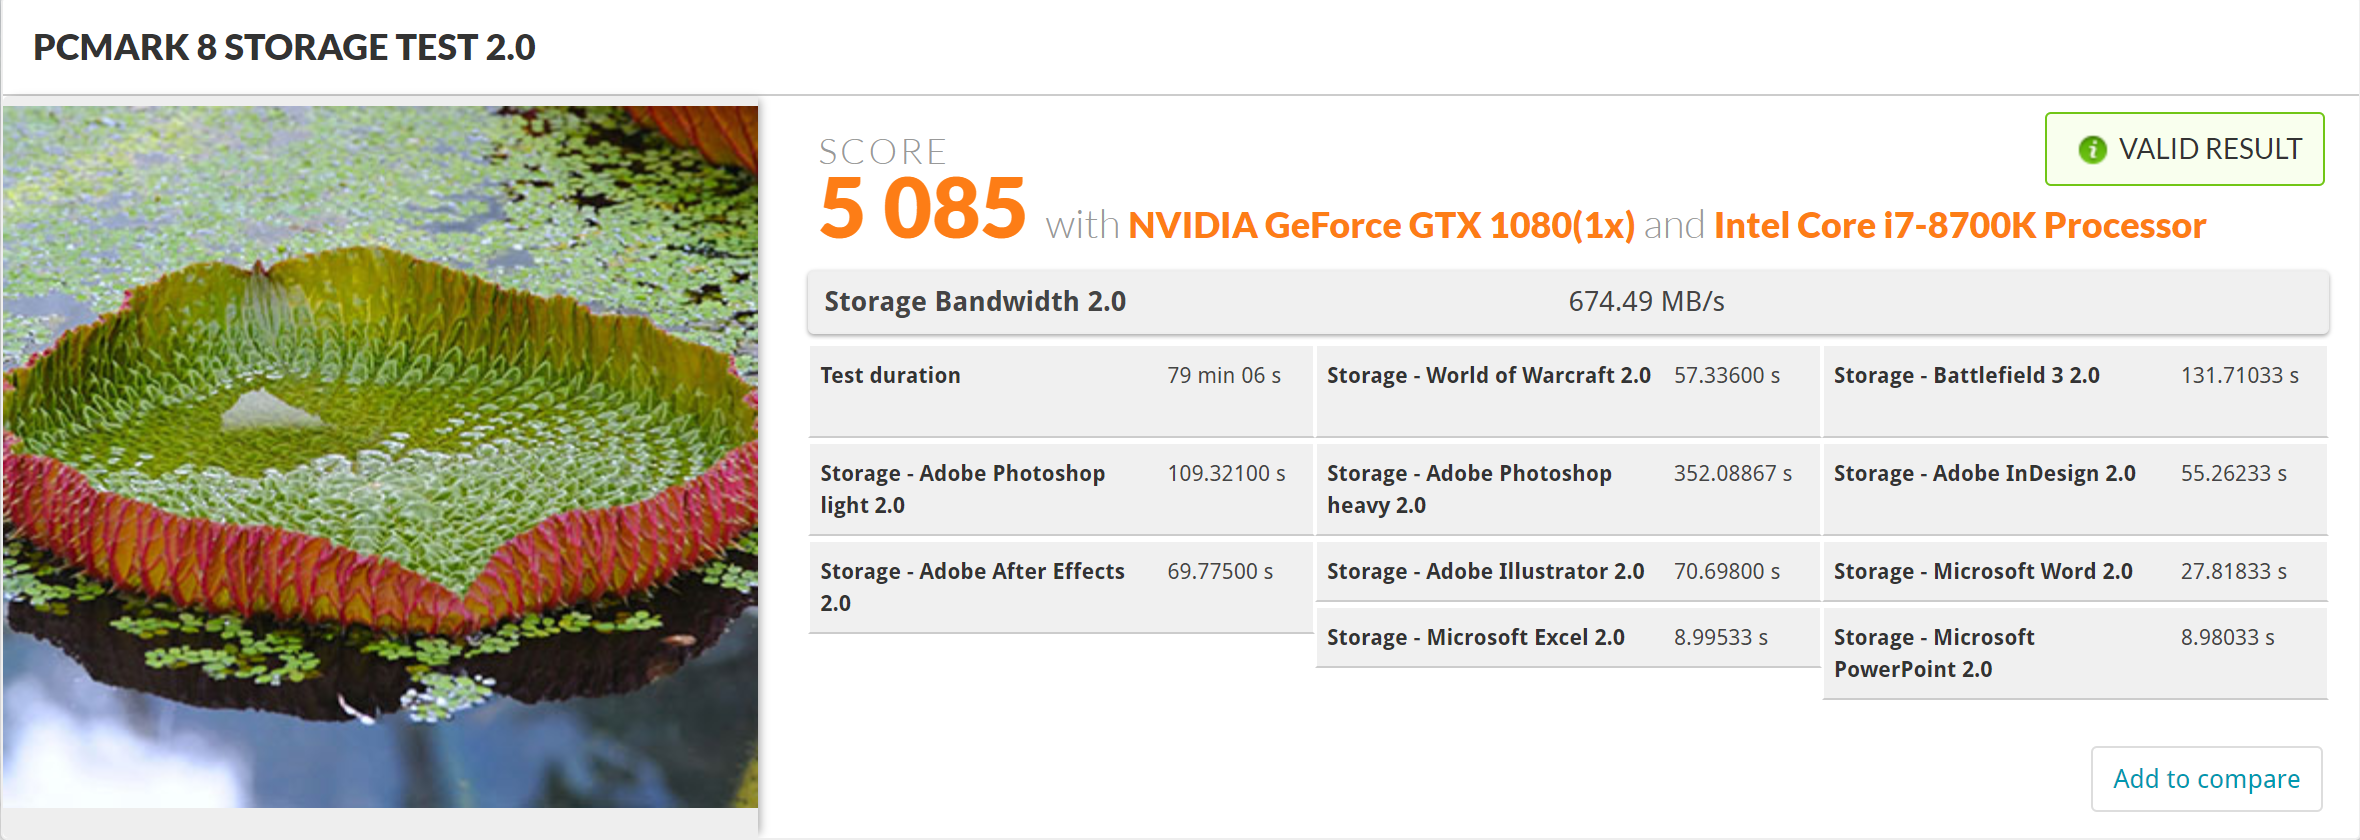
Very decent results with 5085 total points and an average Storage Bandwidth of 674MB/s; this is in our top ten results.
Agaim, a non usable review, as tests using only 1gb uses slc cache so these are mp real numbers, You are not a pro. A pro rrview must use at least 32Gb tedts
The SM* controllers are said, in others reviews, to have really bad power to performance ratio. I wish you would test the power consumption of this drive.
Great review! Thank you!
You are welcome…
Thank you for every other informative website. The place else
could I am getting that type of information written in such
an ideal way? I have a challenge that I am simply now working on, and I’ve been on the glance out for such info.