
For our last benchmark, we have decided to use PCMark 8 Extended Storage Workload in order to determine steady state throughput of the SSD. This software is the longest in our battery of tests and takes just under 18 hours per SSD. As this is a specialized component of PCMark 8 Professional, its final result is void of any colorful graphs or charts typical of the normal online results and deciphering the resulting excel file into an easily understood result takes several more hours.
There are 18 phases of testing throughout the entire run, 8 runs of the Degradation Phase, 5 runs of the Steady State Phase and 5 runs of the Recovery Phase. In each phase, several performance tests are run of 10 different software programs; Adobe After Effects, Illustrator, InDesign, Photoshop Heavy and Photoshop Light, Microsoft Excel, PowerPoint and Word, as well as Battlefield 3 and World of Warcraft to cover the gaming element.
- PRECONDITIONING -The entire SSD is filled twice sequentially with random data of a 128KB file size. The second run accounts for overprovisioning that would have escaped the first;
- DEGRADATION PHASE – The SSD is hit with random writes of between 4KB and 1MB for 10 minutes and then a single pass performance test is done of each application. The cycle is repeated 8 times, and with each time, the duration of random writes increases by 5 minutes;
- STEADY STATE PHASE – The drive is hit with random writes of between 4KB and 1MB for 45 minutes before each application is put through a performance test. This process is repeated 5 times;
- RECOVERY PHASE – The SSD is allowed to idle for 5 minutes before and between performance tests of all applications. This is repeated 5 times which accounts for garbage collection; and
- CLEANUP – The entire SSD is written with zero data at a write size of 128KB
In reading the results, the Degrade and Steady State phases represent heavy workload testing while the recovery phase represents typical consumer light workload testing.
As you can see, performance is recorded in terms of Bandwidth and Latency. Bandwidth (or throughput) represents the total throughput the drive is able to sustain during the tests during each phase. Latency, at least for the purposes of PCMark 8, takes on a different outlook and for this, we will term it ‘Total Storage latency’. Typically, latency has been addressed as the time it takes for a command to be executed, or rather, the time from when the last command completed to the time that the next command started. This is shown below as ‘Average Latency’.
PCMark 8 provides a slightly different measurement, however, that we are terming as ‘Total Storage Latency’. This is represented as being the period from the time the last command was completed, until the time it took to complete the next task; the difference of course being that the execution of that task is included in ‘Total Storage Latency’. For both latency graphs, the same still exists where the lower the latency, the faster the responsiveness of the system will be. While both latency charts look very similar, the scale puts into perspective how just a few milliseconds can increase the length of time to complete multiple workloads.
For a more in-depth look into Latency, Bandwidth, and IOPS check out our primer article on them here.
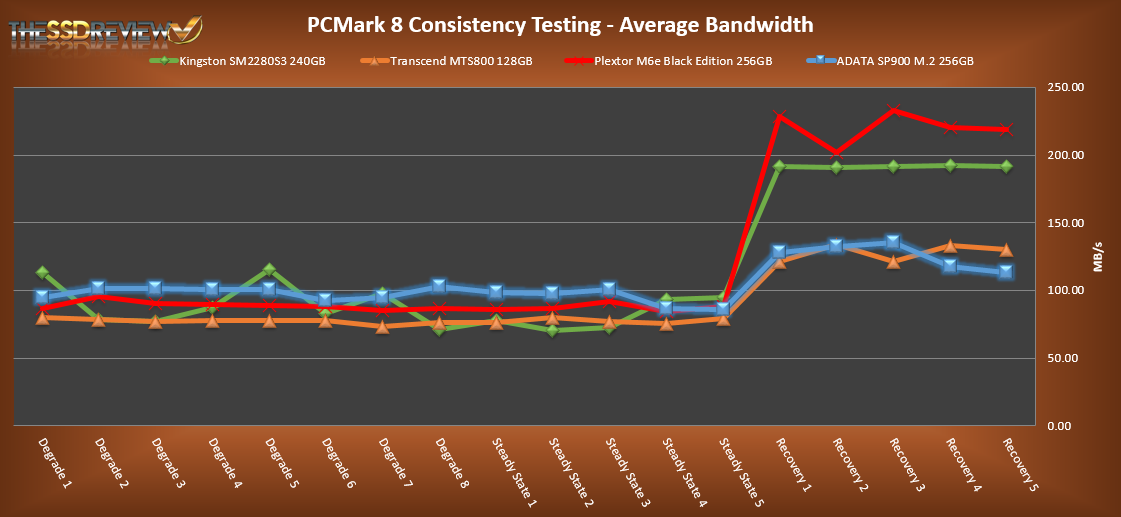
AVERAGE BANDWIDTH (OR THROUGHPUT)
These results show the total average bandwidth across all tests in the 18 phases. In this graph the higher the result the better.
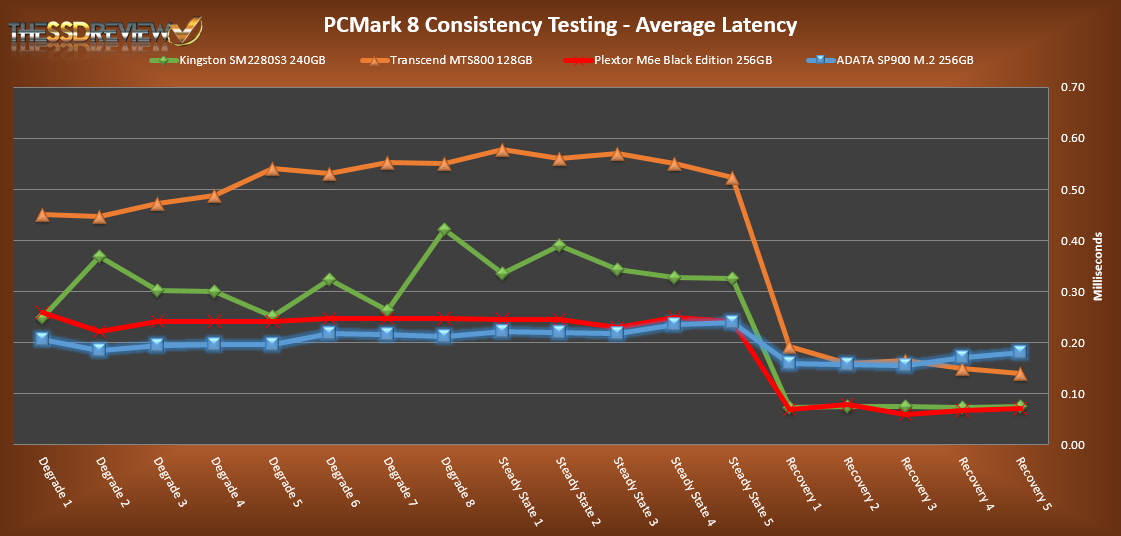
AVERAGE LATENCY (OR ACCESS TIME)
These results show the average access time during the workloads across all tests in the 18 phases. In this graph the lower the result the better.
TOTAL STORAGE LATENCY
These results show the total access time across all tests in the 18 phases. In this graph the lower the result the better.
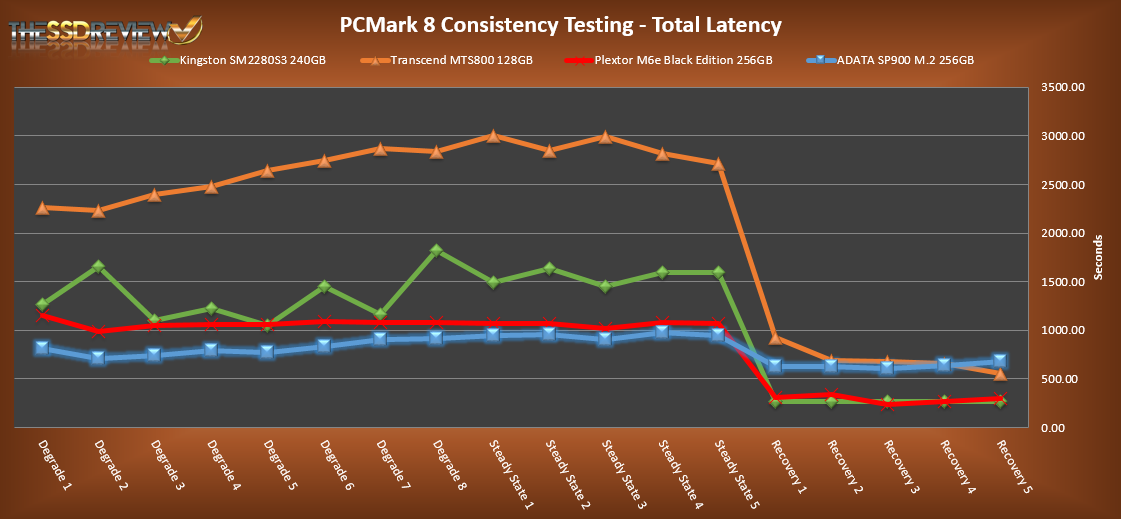 From our PCMark 8 consistency testing results we can quickly identify this drive is a mainstream consumer SSD. Starting with average bandwidth we can see under heavy workloads the SandForce controller is still very competitive with modern controllers. However, once we get to the consumer workloads we can see that the Marvell and Phison powered SSDs take a lead. The same trend follows with latency measurements. Average and overall latency for the ADATA Premier Pro SP900 M.2 is lower than the competition through the heavy workload phases, however once when the recovery stages come into play, latency doubles that of the other Marvell and Phison powered SSDs. Overall, as the first SandForce drive we have done this type of testing on, the performance out of the SSD is quite good and came as a nice surprise.
Would be best if this article started off by clearly stating if this is PCI-e or mSATA M.2. This is a big issue with the M.2 form factor – lack of clarity.
There is no such things as mSATA M.2. I am going to guess you meant SATA however, which is exactly the same as 6Gbps which is listed right after M.2 in the title. I might suggest lack of understanding rather than lack of clarity. 6Gbps is understood as SATA 3 since thats what it has always been. Thanks for taking the time.
From Wiki: “M.2, formerly known as the Next Generation Form Factor (NGFF), is a specification for internally mounted computer expansion cards and associated connectors. It replaces the mSATA standard, which uses the PCI Express Mini Card physical layout. M.2’s more flexible physical specification that allows different module widths and lengths, together with more advanced features, makes the M.2 more suitable for solid-state storage applications in general, especially when used in small devices like ultrabooks or tablets”
Does the 2242 have the same performance as the 2280? A lot of ultrabooks now only can fit 2242 slots but there is not a lot of choices or good reviews of the few choices in that size.
It depends on the combination of controller, memory and even DRAM cache. As the 2242 can accommodate less physical memory pieces, this could play a role in the end performance of the SSD.
Well specifically I meant the 2242
ADATA Premier Pro SP900 M.2. I think the review could use a blurb at the end. Like this model also comes in 42mm but the performance is about xx % less than the 80mm we reviewed.
I was thinking of buying it but cannot find any comparisons between it and the mydigitalssd models. Or even separate performance benchmarks I could compare on my own. Seems to be a real gap in information with the new thinkpads and many other models only fitting 42mm m.2s
My reply didn’t state that there was a performance difference, but rather, there may be and the reasoning for such. We can only comment on what we test and, having not compared both, could not make such a comment on our report. Thanks for the concern and we will see what we can do about getting the other in for testing.