

CRYSTAL DISK BENCHMARK VER. 4.0.3 X64
Crystal Disk Benchmark is used to measure read and write performance through sampling of random data which is, for the most part, incompressible. Performance is virtually identical, regardless of data sample so we have included only that using random data samples.
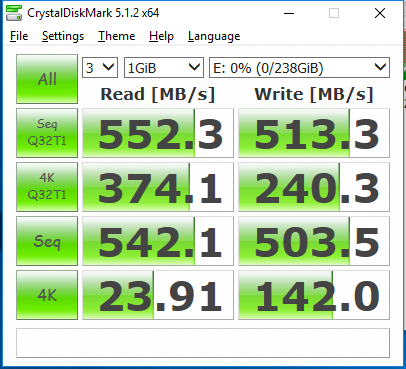
256GB
512GB 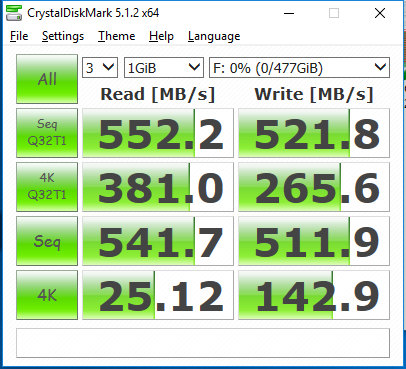
1TB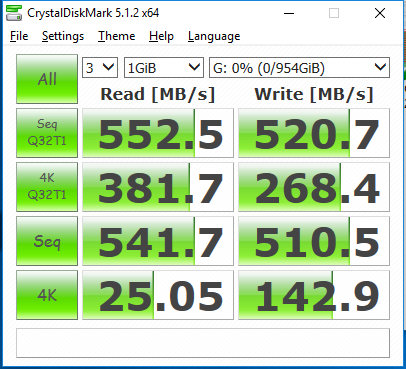
Crystal Disk Mark gives us a better look at performance. Sequential speeds are on par with the official specifications, but we can see that 4K performance is a bit lower than we were hoping for. In contrast with what we saw with ATTO, the 4KB performance is a bit lower than the VR180 the VX500 replaces. The 4K read performance at QD1 is very low for a mainstream offering.
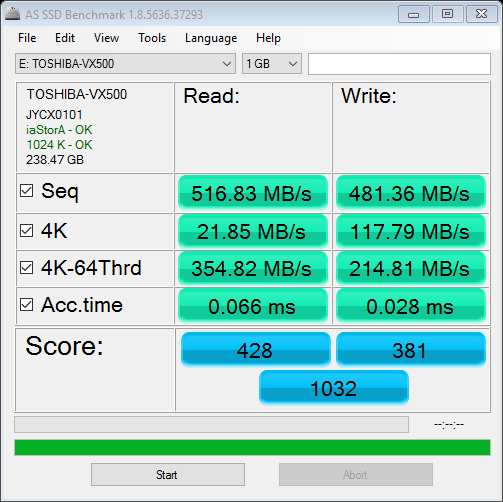
The toughest benchmark available for solid state drives is AS SSD as it relies solely on incompressible data samples when testing performance. For the most part, AS SSD tests can be considered the ‘worst case scenario’ in obtaining data transfer speeds and many enthusiasts like AS SSD for their needs. Transfer speeds are displayed on the left with IOPS results on the right.
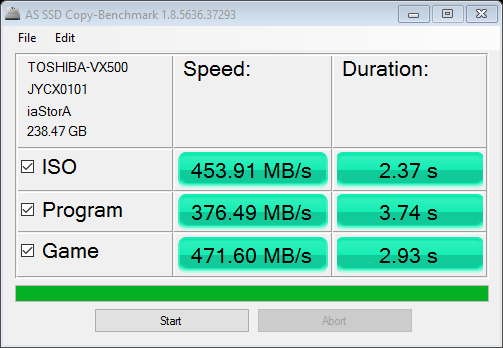
256GB

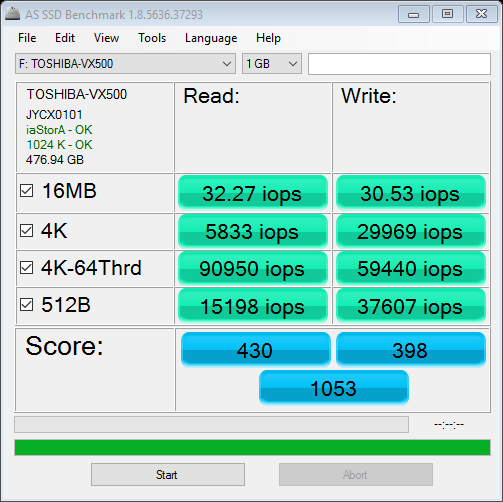
512GB


1TB

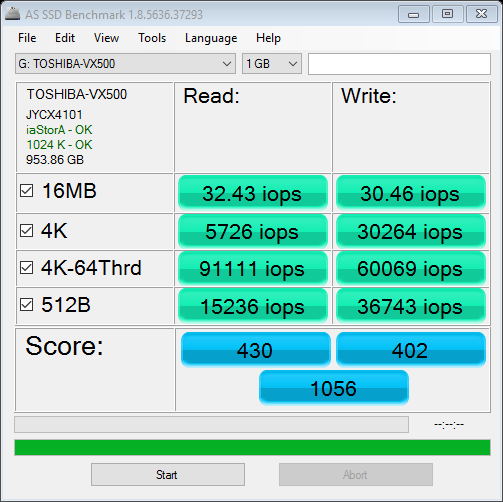
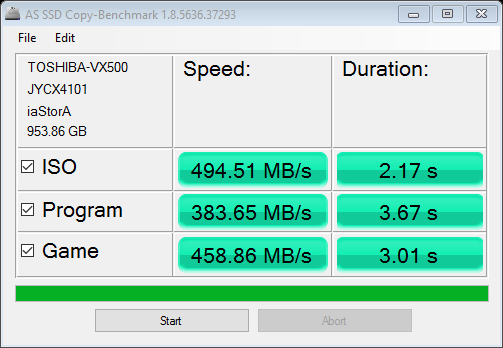
In AS SSD the VX500 delivers overall scores of around 1030 – 1050 points. Sequential speeds are around 500MB/s, but again, 4K performance is lower than we were hoping. All models achieved over 90K IOPS read and for write IOPS performance ranged from 55K to 60K. Luckily, the file copy benchmarks there is a notable improvement in performance over the VR180. So that is something to look forward to when we perform some real world benchmarking.
ANVIL STORAGE UTILITIES PROFESSIONAL
Anvil’s Storage Utilities (ASU) are the most complete test bed available for the solid state drive today. The benchmark displays test results for, not only throughput but also, IOPS and Disk Access Times. Not only does it have a preset SSD benchmark, but also, it has included such things as endurance testing and threaded I/O read, write and mixed tests, all of which are very simple to understand and use in our benchmark testing.
256GB

512GB

1TB
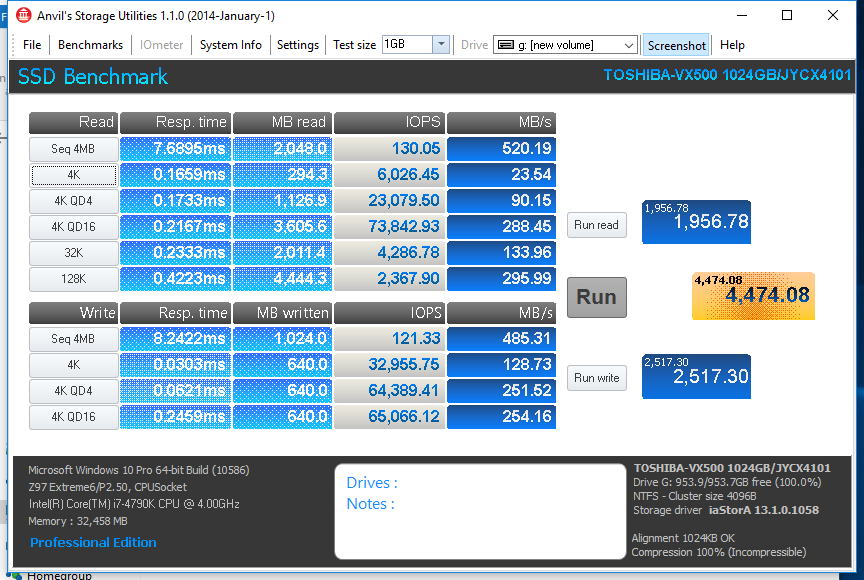
Anvil Storage Utilities also shows us similar results to what we have previously seen. Performance is very close between all the capacities with results giving a slight edge to the larger models. Total scores ranging from 4200 to 4500 were achieved here, placing the VX500 in line with the many mainstream offerings it is competing against.
Where is the hd tune pro chart to see what happens after slc runs out?
After running HDTune on all capacities we tested there was no drop off in write performance. All maintained about 490MB/s write across the board.
That sounds like one of the highest read / write averages for a sata3 ssd from start to finish. Am I right? Thank goodness for mlc.
It is up there for sure. We have not tested write performance with many other MLC SSDs in HDTune so I can not say for sure one of the highest, but it sure is good!
Now that’s the way a HD Tune chart should look. Nice! I hope they keep making mlc drives because I cant believe companies are still trying to sell us on write speed does not matter. If we wanted slow write speeds we would stick with hard drives.
I find it highly unlikely, that 256GB model can hit sustained 490MB/s write. MLC is good, but not that good. That would require 64Gbit dies to achieve.
The heading / advertisement should read. This mlc ssd is not just good its great!
I get sick of seeing this nonsense… ‘Once formatted the 256GB model has 238GB of usable space’.
You should know better, it’s simply a difference of GB vs GiB.
The majority of our readers do not know this unfortunately and thus we provided this information as we do.
Actually, the statement is 100% correct. Typical consumers, and in fact, the industry does not advertise or speak of GiB whatsoever in discussing available volume on a SSD. The SSD is a consumer directed SSD and 99.9% of consumers don’t understand GiB whatsoever. They want and deserve to know how much logical space is available to them when the drive is formatted. The freedom to read what we wish is an amazing thing.
I found it funny you got so defensive.
You should be trying at least to educate your readership, rather than just perpetuating myths about lost space through formatting.
You have a strange sense of humour.
You criticized, and Les responded. Yes, that’s defensive.
While your first comment might be true, you shouldn’t be surprised that Les explained why he writes what/how he does… which is also true.
Thank you.
I dont recall ever stating, or rather Sean writing that space was lost after formatting. He simply stated the available space after the drive was formatted. Should he then have to say that, before formatting, there is no available space for storage? Nobody ever spoke of lost space, but rather, at least I think you sought the opportunity to perpetuate the whole GB/GiB scenario.