
The SSD Review uses benchmark software called PCMark Vantage x64 HDD Suite to create testing scenarios that might be used in the typical user experience. There are eight tests in all and the tests performed record the speed of data movement in MB/s to which they are then given a numerical score after all of the tests are complete. The simulations are as follows:
- Windows Defender In Use
- Streaming Data from storage in games such as Alan Wake which allows for massive worlds and riveting non-stop action
- Importing digital photos into Windows Photo Gallery
- Starting the Vista Operating System
- Home Video editing with Movie Maker which can be very time consuming
- Media Center which can handle video recording, time shifting and streaming from Windows media center to an extender such as Xbox
- Cataloging a music library
- Starting applications
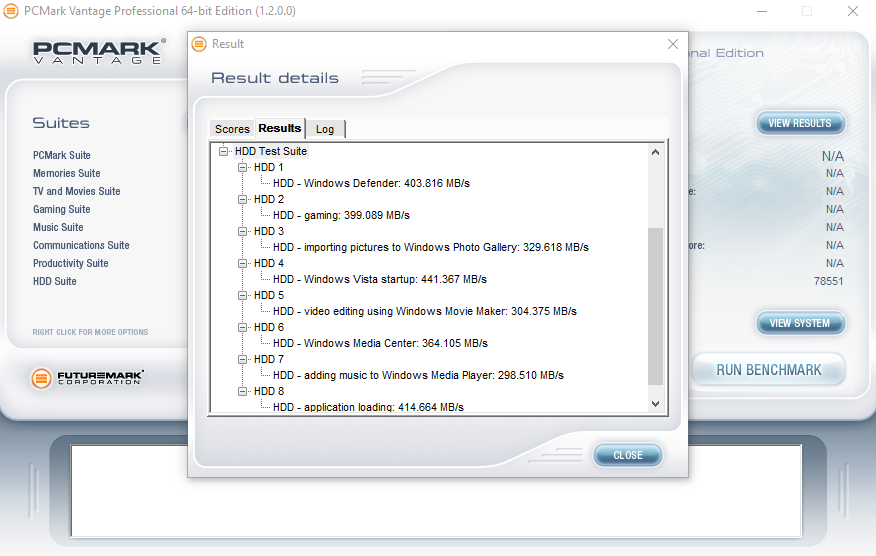
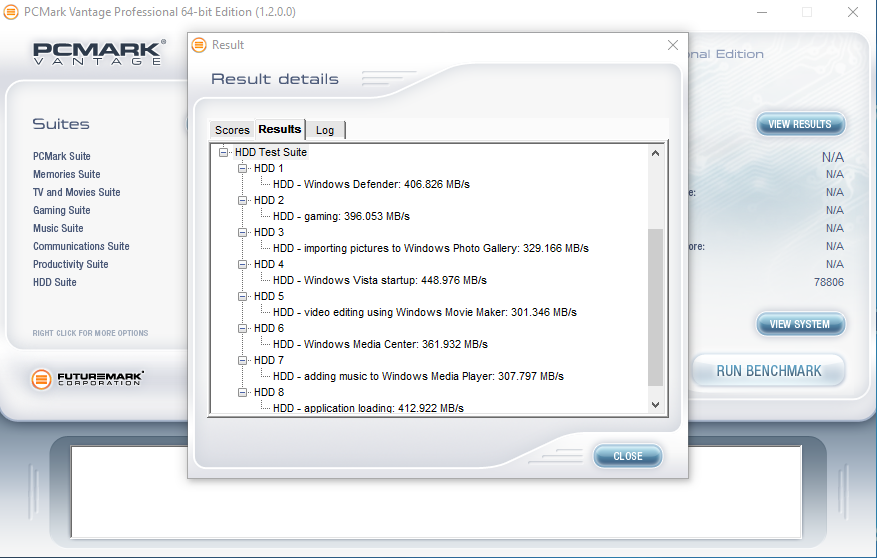
PCMARK VANTAGE RESULTS
In PCMark Vantage the TL100 doesn’t do half bad. It achieved over 78K in this test for both models, which is similar to the performance we saw from the Vector 180, or now VR180. Speeds during each sub-test in PCMark Vantage range from 300MB/s to over 400MB/s. The best being in the startup phase and the worst being in the adding music to Windows Media Player benchmark. Let’s move on to PCMark 8 to better gauge this SSDs performance in relation to other SSDs in the market.
120GB
240GB
PCMARK 8 EXTENDED STORAGE WORKLOAD CONSISTENCY TESTING
For our last benchmark, we have decided to use PCMark 8 Extended Storage Workload in order to determine steady state throughput of the SSD. This software is the longest in our battery of tests and takes just under 18 hours per SSD. As this is a specialized component of PCMark 8 Professional, its final result is void of any colorful graphs or charts typical of the normal online results and deciphering the resulting excel file into an easily understood result takes several more hours.
There are 18 phases of testing throughout the entire run, 8 runs of the Degradation Phase, 5 runs of the Steady State Phase and 5 runs of the Recovery Phase. In each phase, several performance tests are run of 10 different software programs; Adobe After Effects, Illustrator, InDesign, Photoshop Heavy and Photoshop Light, Microsoft Excel, PowerPoint and Word, as well as Battlefield 3 and World of Warcraft to cover the gaming element.
- PRECONDITIONING -The entire SSD is filled twice sequentially with random data of a 128KB file size. The second run accounts for overprovisioning that would have escaped the first;
- DEGRADATION PHASE – The SSD is hit with random writes of between 4KB and 1MB for 10 minutes and then a single pass performance test is done of each application. The cycle is repeated 8 times, and with each time, the duration of random writes increases by 5 minutes;
- STEADY STATE PHASE – The drive is hit with random writes of between 4KB and 1MB for 45 minutes before each application is put through a performance test. This process is repeated 5 times;
- RECOVERY PHASE – The SSD is allowed to idle for 5 minutes before and between performance tests of all applications. This is repeated 5 times which accounts for garbage collection; and
- CLEANUP – The entire SSD is written with zero data at a write size of 128KB
In reading the results, the Degrade and Steady State phases represent heavy workload testing while the recovery phase represents typical consumer light workload testing.
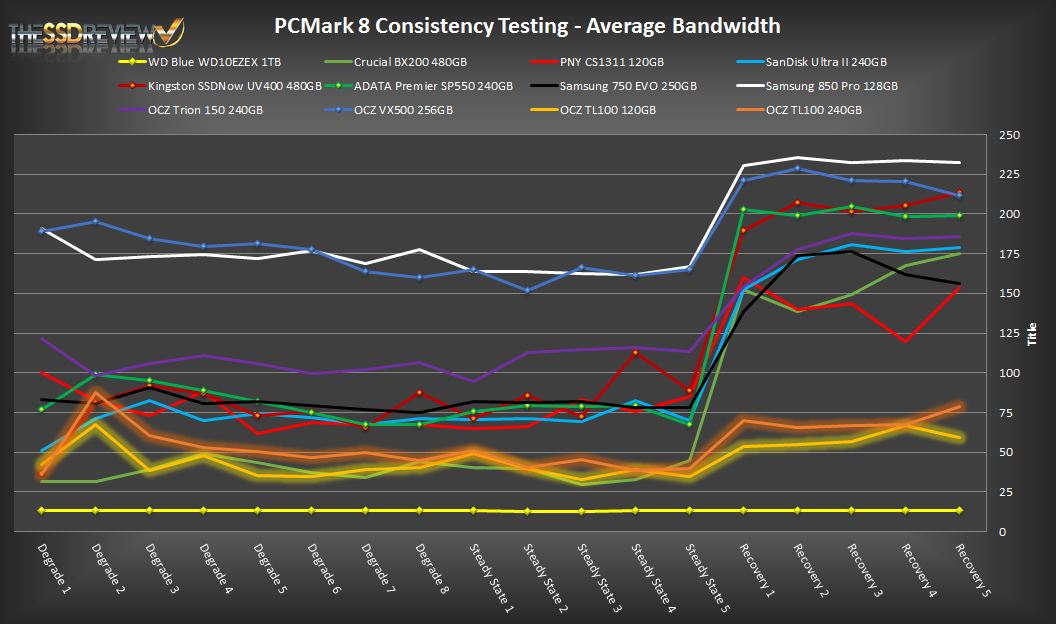
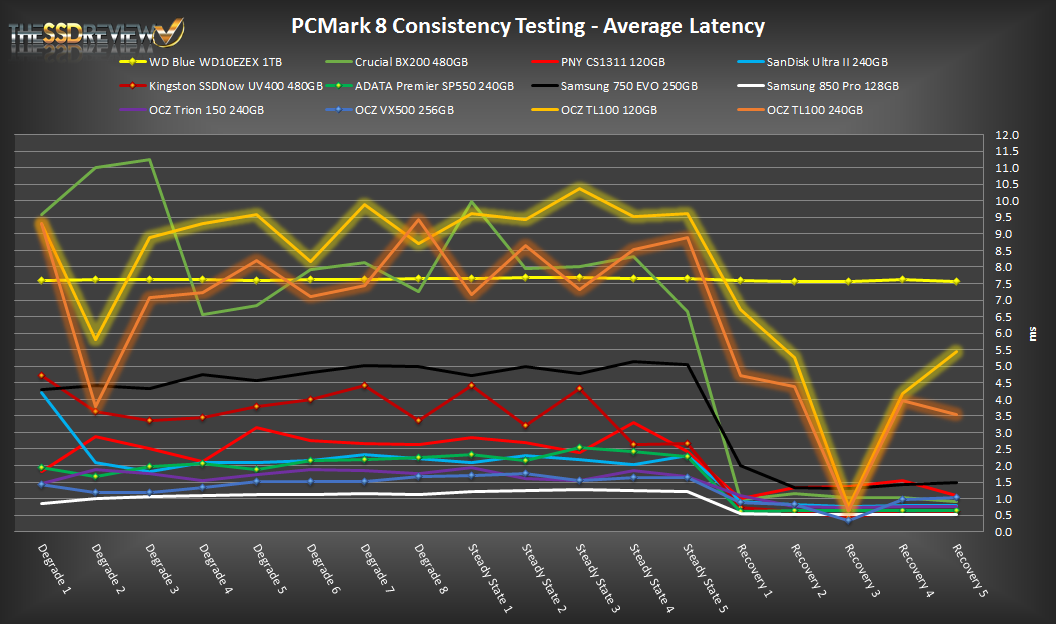
As you can see, performance is recorded in terms of Bandwidth and Latency. Bandwidth (or throughput) represents the total throughput the drive is able to sustain during the tests during each phase. Latency, at least for the purposes of PCMark 8, takes on a different outlook and for this, we will term it ‘Total Storage Latency’. Typically, latency has been addressed as the time it takes for a command to be executed, or rather, the time from when the last command completed to the time that the next command started. This is shown below as ‘Average Latency’.
PCMark 8 provides a slightly different measurement, however, that we are terming as ‘Total Storage Latency’. This is represented as being the period from the time the last command was completed, until the time it took to complete the next task; the difference of course being that the execution of that task is included in ‘Total Storage Latency’. For both latency graphs, the same still exists where the lower the latency, the faster the responsiveness of the system will be. While both latency charts look very similar, the scale puts into perspective how just a few milliseconds can increase the length of time to complete multiple workloads.
For a more in-depth look into Latency, Bandwidth, and IOPS check out our primer article on them here.
AVERAGE BANDWIDTH (OR THROUGHPUT)
These results show the total average bandwidth across all tests in the 18 phases. In this graph the higher the result the better.
AVERAGE LATENCY (OR ACCESS TIME)
These results show the average access time during the workloads across all tests in the 18 phases. In this graph the lower the result the better.
TOTAL STORAGE LATENCY
These results show the total access time across all tests in the 18 phases. In this graph the lower the result the better.
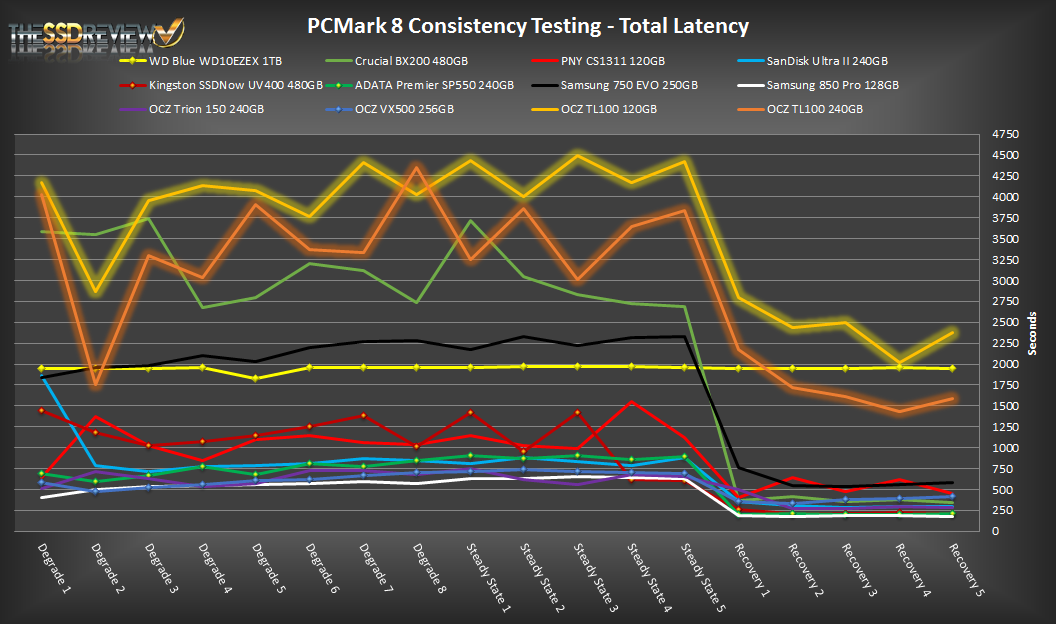
PCMark 8’s extended consistency test reveals that the TL100 is not the SSD you are looking for if you want to do anything more than office work and browsing the internet. The latency results show us that under heavy workloads that it can be worse than a standard hard drive. It even shows higher latency results than the Crucial BX200, which has been the worst performing SSD in this test as of yet in the degrade and steady state phase. When it reaches the recovery phases, performance improves…slightly. It is not able to fully recover and thus shows latency results that are 4x worse than most other drives and the worse throughput performance we have seen to date. But, taking a step back now and analyzing this result, we need to take into consideration the workload that was thrown at the drive and understand that these results are not technically representative of its performance in an end user’s system. To have a better understanding of its performance characteristics we turn to the results of a normal run of PCMark’s Storage test. This will allow us to see where it truly stands, where there isn’t such a hard workload thrown at it before testing and where the workload is more representative of a real-world load.
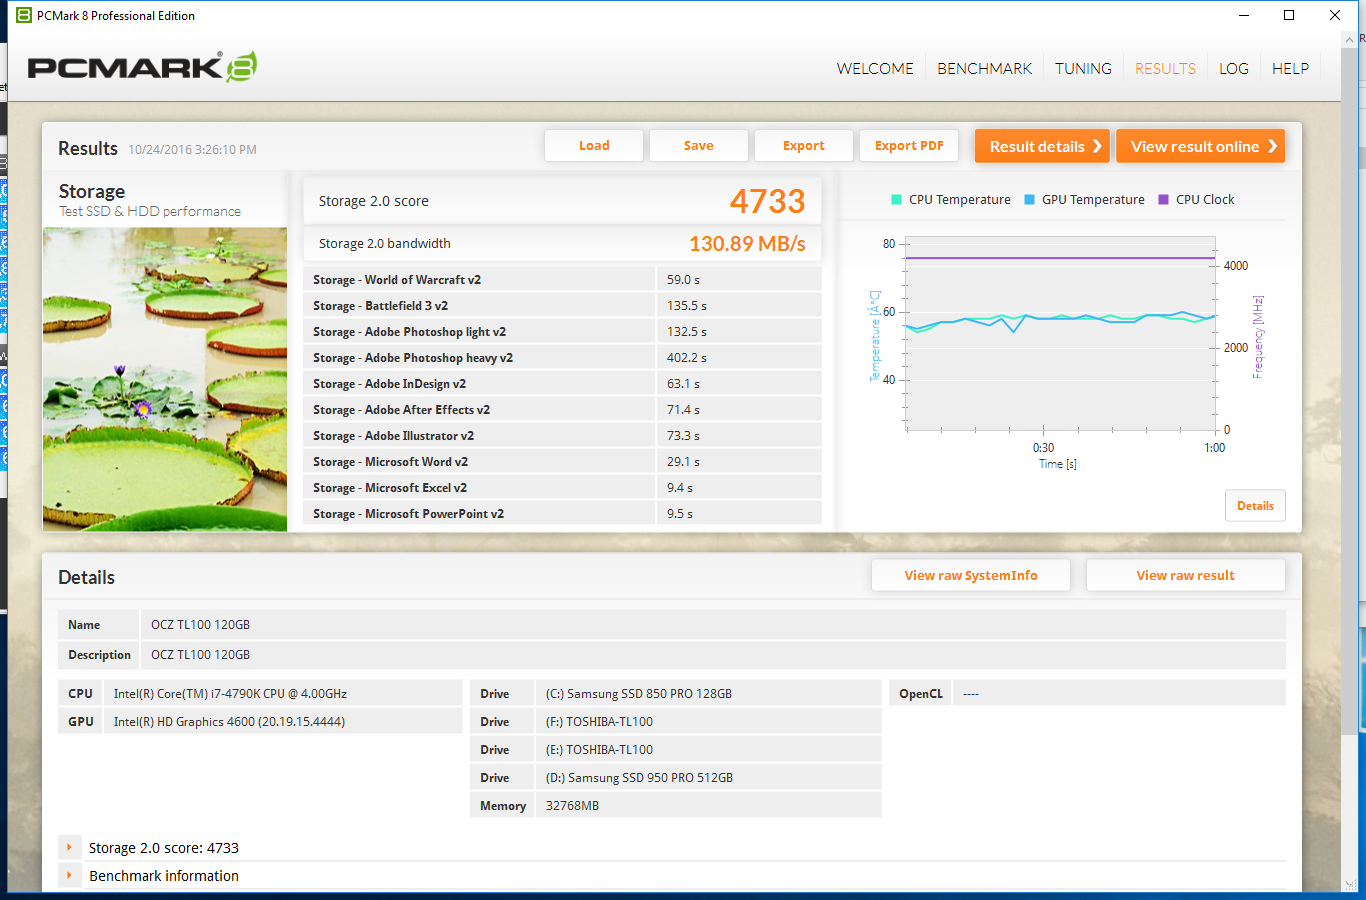
120GB
240GB
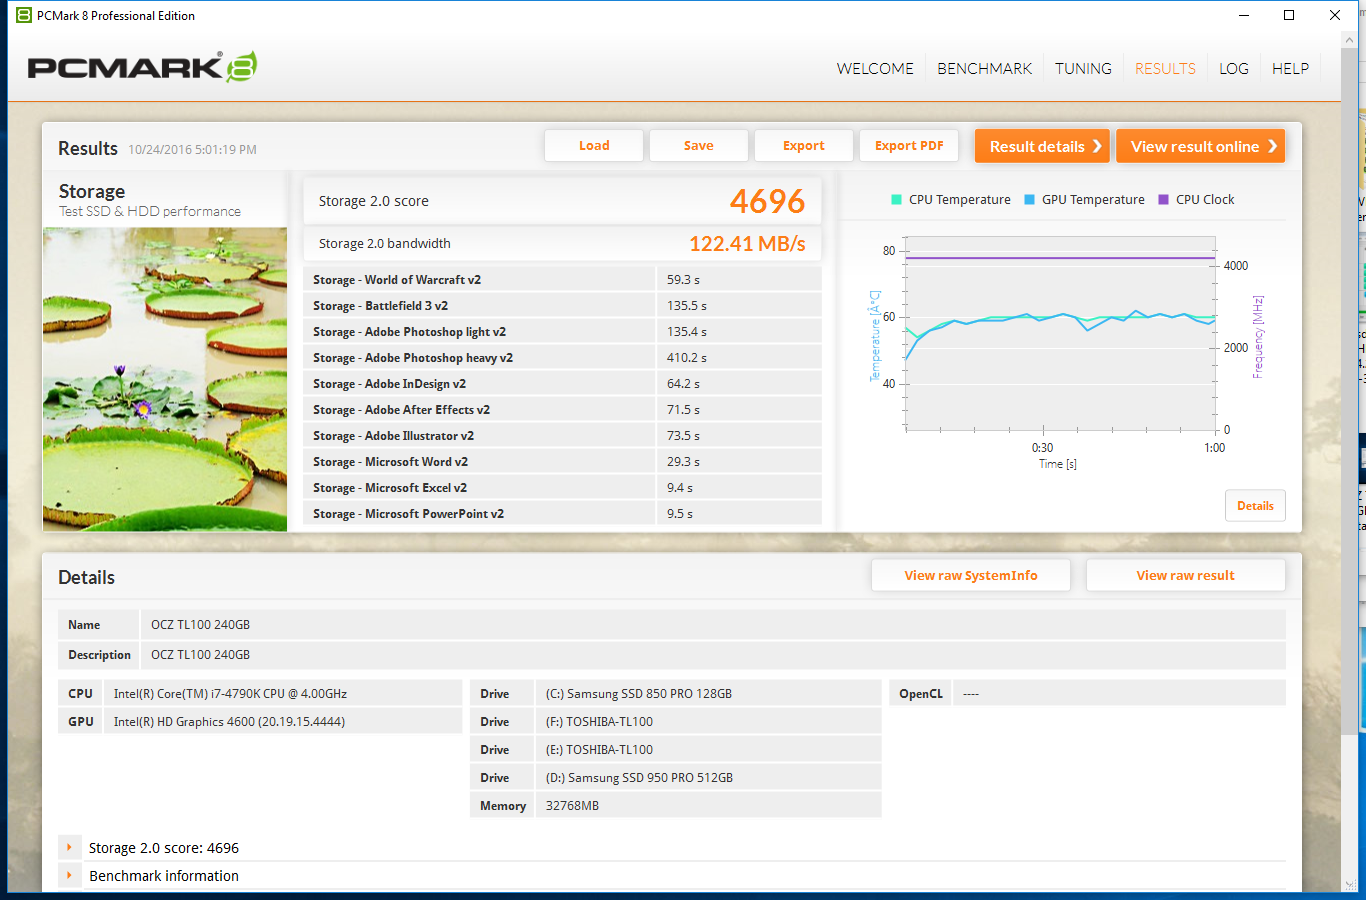
The 120GB model maintained an average of 130MB/s bandwidth while the 240GB model averaged 122MB/s. With these results, we can see that again, the 120GB has a slight lead over the 240GB capacity. This is possibly due to more LBAs to map out on the NAND located LBA table and thus it takes more time to read/write/modify.
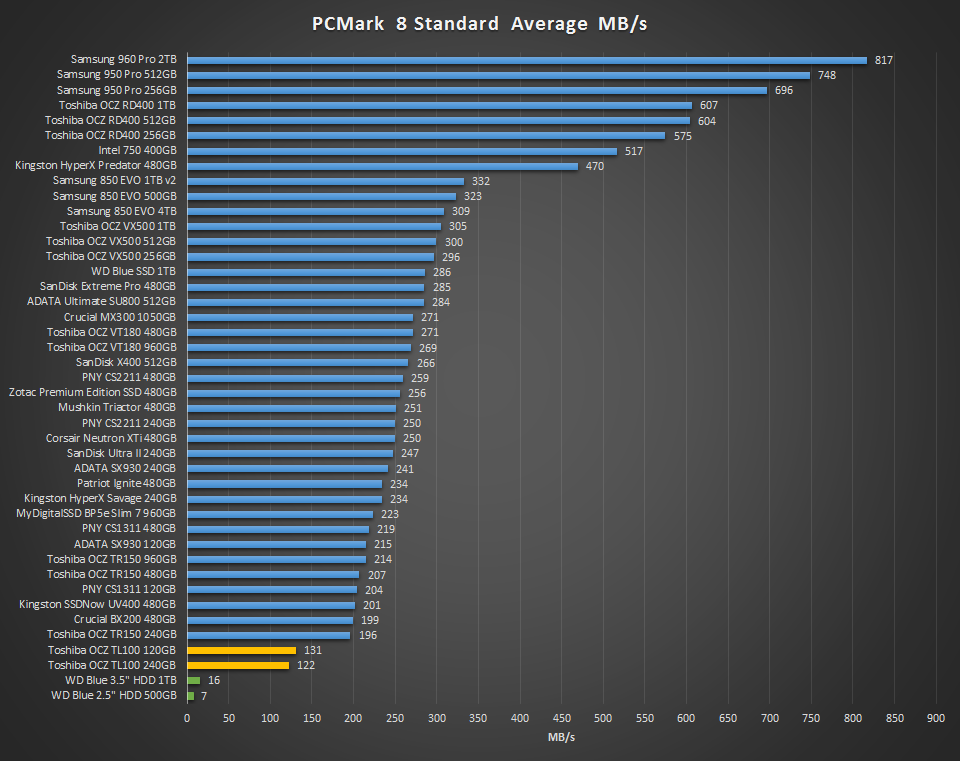
In our hierarchy chart, we can see that these results, again, place the TL100 in last place when compared to other SSDs we have tested by a fair margin. On the flipside of this, however, they perform much better than their HDD competition, which is the main objective for this SSD. Performance from the OCZ TL100 is 8-15x better than that of a HDD.
thanks for your honest pros and cons review. instead of the buy it its cheap and better than a hd.
Hi Sean,
When I saw those 4K-QD1 Nos I thought can’t be TLC-Can’t be ram-less,oooooh.
(EDIT-Sean was it really as responsive as those Nos show?)
It’s getting almost impossible today to find a good/reasonable priced 120/128 GB
boot drive since the 120-850EVO went EOL.
Then we got to the real world tests, noooooooooooooooo.
It’s below the BX200-which deserves lemon status.
Then HD-Tune picked it………
CONCLUSION-IGNORE ALL SYNTHETIC TESTS WITH THESE DRIVES…………..
till page 3:
WOW high performance
starting with page 4:
WTF worse than and hdd
I got the 240 GB and it’s slow… Read speed doesn’t goes up from 420 Mbps and write from 110 Mbps… I have ACHI drivers and other little twerks, but still almost the same… Somebody please tell me if my disk it’s broken or something… The storage is fine and I tryed it on other pc, same results…
To see real write speeds in HD Tune, you can/should use Erase optionç I am always doing that. It has a Zero and random options and they are mostly incompressible as each write operation is performed block by block.