
The SSD Review uses benchmark software called PCMark Vantage x64 HDD Suite to create testing scenarios that might be used in the typical user experience. There are eight tests in all and the tests performed record the speed of data movement in MB/s to which they are then given a numerical score after all of the tests are complete. The simulations are as follows:
- Windows Defender In Use
- Streaming Data from storage in games such as Alan Wake which allows for massive worlds and riveting non-stop action
- Importing digital photos into Windows Photo Gallery
- Starting the Vista Operating System
- Home Video editing with Movie Maker which can be very time consuming
- Media Center which can handle video recording, time shifting and streaming from Windows media center to an extender such as Xbox
- Cataloging a music library
- Starting applications
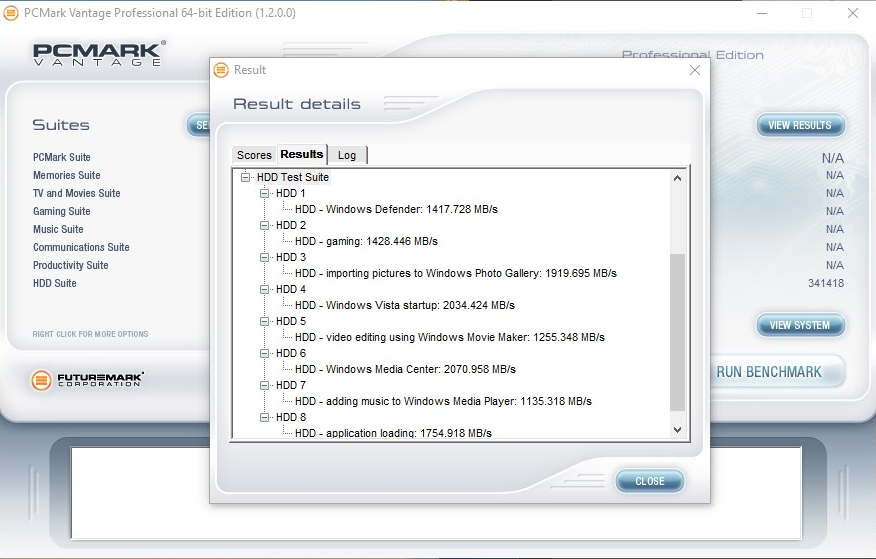
PCMARK VANTAGE RESULTS
In PCMark Vantage the 960 EVOs achieved 337K and 341K points respectively. These are excellent results that even beat the 960 Pro we tested! The 1TB model’s result of 341K is even ranks it as the highest result we have gotten in this test so far! All performance speeds were over 1GB/s with the majority around 1.5GB/s and up to 2GB/s in two tests for both drives. Overall, these are killer results. Let’s see how PCMark 8 ranks these bad boys.
250GB
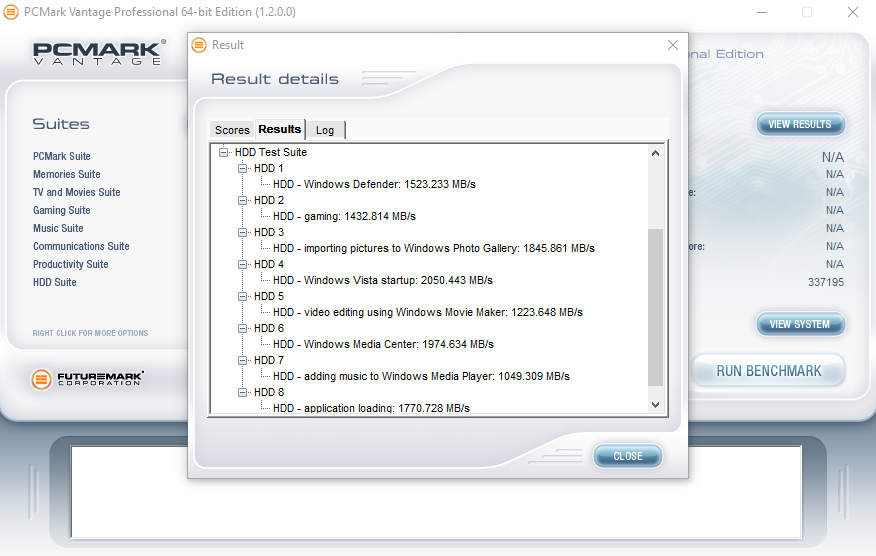
1TB
PCMARK 8 EXTENDED STORAGE WORKLOAD CONSISTENCY TESTING
For our last benchmark, we have decided to use PCMark 8 Extended Storage Workload in order to determine steady state throughput of the SSD. This software is the longest in our battery of tests and takes just under 18 hours per SSD. As this is a specialized component of PCMark 8 Professional, its final result is void of any colorful graphs or charts typical of the normal online results and deciphering the resulting excel file into an easily understood result takes several more hours.
There are 18 phases of testing throughout the entire run, 8 runs of the Degradation Phase, 5 runs of the Steady State Phase and 5 runs of the Recovery Phase. In each phase, several performance tests are run of 10 different software programs; Adobe After Effects, Illustrator, InDesign, Photoshop Heavy and Photoshop Light, Microsoft Excel, PowerPoint and Word, as well as Battlefield 3 and World of Warcraft to cover the gaming element.
- PRECONDITIONING -The entire SSD is filled twice sequentially with random data of a 128KB file size. The second run accounts for overprovisioning that would have escaped the first;
- DEGRADATION PHASE – The SSD is hit with random writes of between 4KB and 1MB for 10 minutes and then a single pass performance test is done of each application. The cycle is repeated 8 times, and with each time, the duration of random writes increases by 5 minutes;
- STEADY STATE PHASE – The drive is hit with random writes of between 4KB and 1MB for 45 minutes before each application is put through a performance test. This process is repeated 5 times;
- RECOVERY PHASE – The SSD is allowed to idle for 5 minutes before and between performance tests of all applications. This is repeated 5 times which accounts for garbage collection; and
- CLEANUP – The entire SSD is written with zero data at a write size of 128KB
In reading the results, the Degrade and Steady State phases represent heavy workload testing while the recovery phase represents typical consumer light workload testing.
As you can see, performance is recorded in terms of Bandwidth and Latency. Bandwidth (or throughput) represents the total throughput the drive is able to sustain during the tests during each phase. Latency, at least for the purposes of PCMark 8, takes on a different outlook and for this, we will term it ‘Total Storage Latency’. Typically, latency has been addressed as the time it takes for a command to be executed, or rather, the time from when the last command completed to the time that the next command started. This is shown below as ‘Average Latency’.
PCMark 8 provides a slightly different measurement, however, that we are terming as ‘Total Storage Latency’. This is represented as being the period from the time the last command was completed, until the time it took to complete the next task; the difference of course being that the execution of that task is included in ‘Total Storage Latency’. For both latency graphs, the same still exists where the lower the latency, the faster the responsiveness of the system will be. While both latency charts look very similar, the scale puts into perspective how just a few milliseconds can increase the length of time to complete multiple workloads.
For a more in-depth look into Latency, Bandwidth, and IOPS check out our primer article on them here.
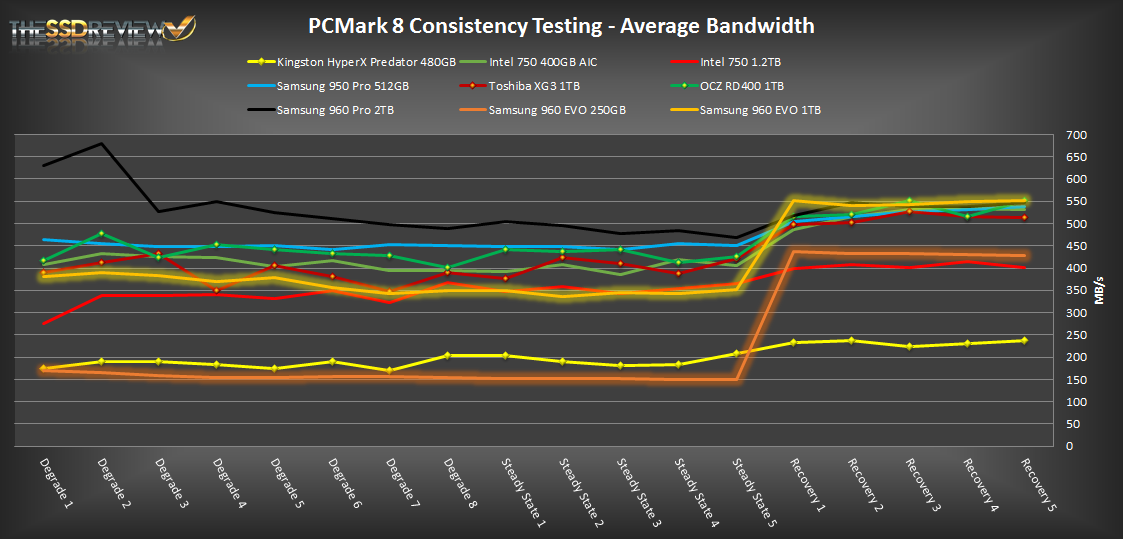
AVERAGE BANDWIDTH (OR THROUGHPUT)
These results show the total average bandwidth across all tests in the 18 phases. In this graph the higher the result the better.
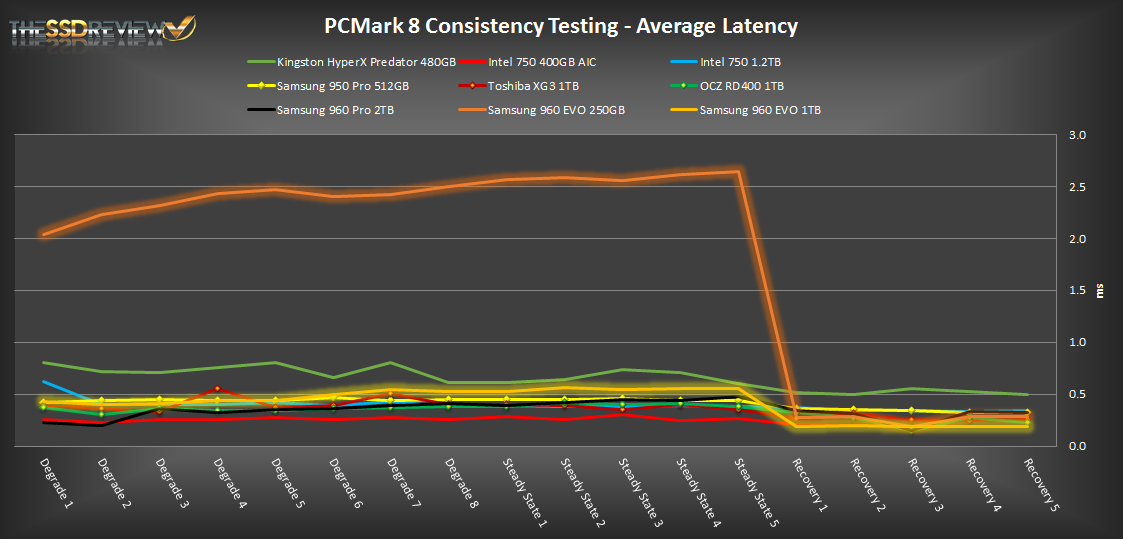
AVERAGE LATENCY (OR ACCESS TIME)
These results show the average access time during the workloads across all tests in the 18 phases. In this graph the lower the result the better.
TOTAL STORAGE LATENCY
These results show the total access time across all tests in the 18 phases. In this graph the lower the result the better.
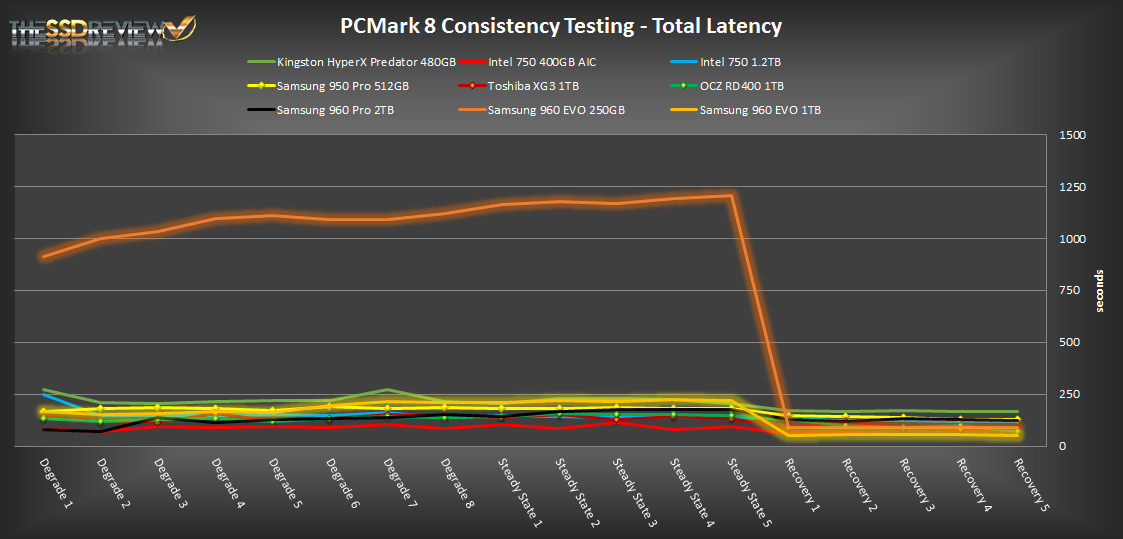
During our extended testing with PCMark 8’s consistency test, we noticed that in the degrade and steady state portions of this test the 250GB model had very high latency and the lowest MB/s compared to the other drives. At the recovery phases, however, it was able to quickly recover and it performed much better and offers much better performance under the more realistic type of desktop use case scenario. It even beat out the 400GB Intel 750. The 1TB model, in contrast, offered much better performance in both the heavy workload and light workload stages. During the recovery section, it is nearly tied with the 960 Pro!
PCMARK 8 STANDARD
To have a better understanding of its performance characteristics we turn to the results of a normal run of PCMark’s Storage test. This will allow us to see where it truly stands, where there isn’t such a hard workload thrown at it before testing and where the workload is more representative of a real-world load. This test is usually the big kahuna. Results here are what hold the most weight in considering which drive is better than another performance wise. So, let’s see how the drive we are testing compares to the rest of the pack!
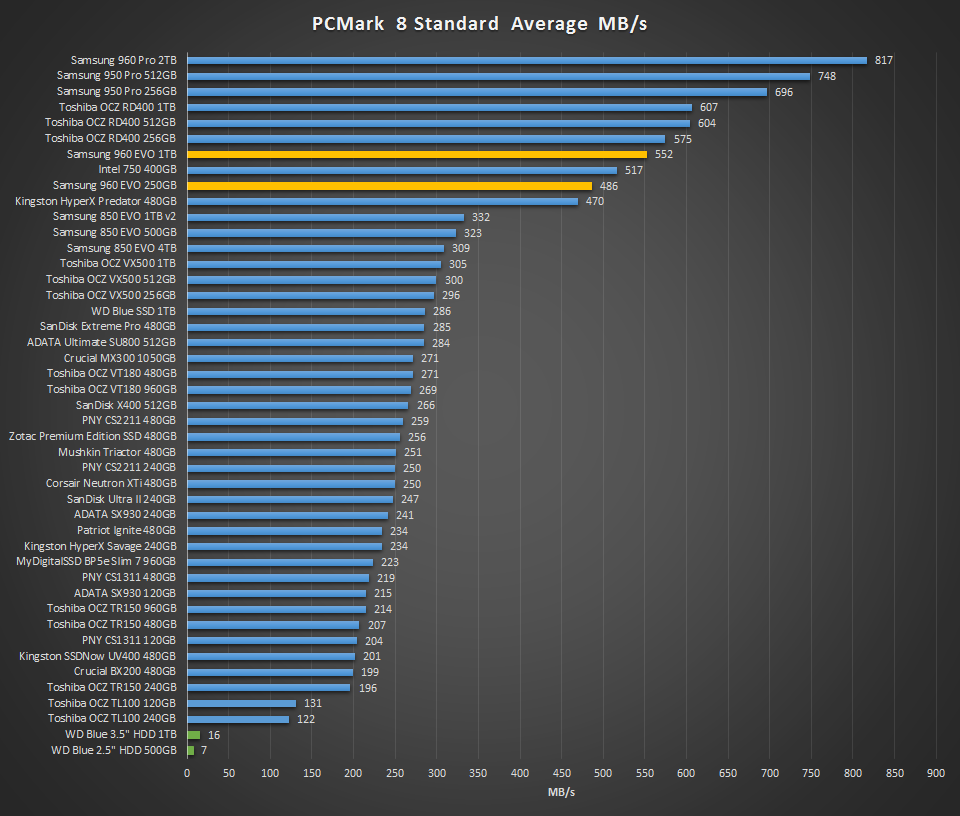
In our standard run of PCMark 8 the Samsung 960 EVOs easily beat out their SATA based brethren by a few hundred MB/s bandwidth, however, they are not top dog in their performance like the 960 Pro, and this was expected. TLC based write performance seems to restrain the 960 EVOs during write portions of the test and TurboWrite just couldn’t give it the edge it needed. Thus, we see MLC based competitors such as the OCZ RD400 beating it out. Still, with overall scores of 486MB/s AND 552MB/s, the 960 EVO is a great performing drive in the upper mainstream segment.
This is a great review. Very detailed and well written, congrats! 🙂 Very “AnandTech” like, and that’s a compliment since I also love their geeky reviews.
One question, if you don’t mind, since you surely have a lot of experience with SSDs:
I own a Asus P8Z68-V Pro motherboard and a Intel 2500k CPU, overclocked to 4.4ghz. Yes, it’s 5 year old but to be honest I didn’t yet really feel the need to upgrade since the last 5 CPU generations were small performance upgrades, and this one still seems to be working great. I blame AMD for that of course, it’s the lack of competition that makes Intel not even try to revolutionize the market.
Here’s the link for my motherboard specs: https://www.asus.com/Motherboards/P8Z68V_PRO/specifications/
I’ve been using a 120gb Vertex 3 Sata drive and it works great but the lack of space is annoying. Doom 2016 game, for instance, is 50gb alone so I had to put it on the HDD drive and the loading time takes forever.
I know that my PCIe is only 1.0 x4 but I could buy a PCIe 3.0 x4 to M.2 adapter for cheap and it would be retro compatible, even if working at lower speeds. Is there a PCIe 2.0 x16 (graphic card length)with to M.2 adapter?
Would I notice any real world difference if I upgrade from my Vertex 3 to a Samsung 960 Evo M.2 SSD with my current setup (with the adapter of course), or should I just buy a 500gb sata Samsung 850 Evo SSD?
And I if go the 850 Evo way, will I notice any performance difference at all?
Thanks 🙂
Cheers
Andre Mendes
No you wouldn’t, unless you transfer/work with very large files.
Thanks for the answer but this was 3 months ago. I just bought a 850 Evo 512gb Sata SSD and it works great. Cheers
Hello,
this is benchmark of a 960 evo m.2 256gb – why is so different (slow) about yours?
https://drive.google.com/file/d/0B6LqA7tts9LeOEpWbk1oeWRidm8/view?usp=sharing
Thank you!
C.
I cannot answer why that result is so much slower than ours. Sorry.
Why are all my results so much faster than yours? 6GB/sec on multiple benchmarks and I only have the 250GB 960 EVO NVMe m.2
DIdn’t tested myself, but I heard that v3 and v5 gives different results, so make sure you use same version from review sites.
This is like SSHD (HDD + 8GB of SSD Cache).
960 EVO is like SSSLC (SSD + 13GB of SLC Cache)
Write 20GB file on SSHD, it drops to 100 MB/s after 8GB.
Write 20GB file on 960 EVO, it drops to 300 MB/s after 13GB, like any cheap SATA SSD.
Just a drive to fool people in thinking they bought the greatest SSD of all time. You actually bought 13GB of fast storage + 237 GB of Kingston V300.
Good job Samsung! You really know how to sell cheap products for hundreds of $$$.
Is it true for the read speed as well? I don’t think I’ll write more than 13 GB at once apart from when I am installing the OS. Can it read all 250 GB at 3300 MBps?
Read and write top performance will ever be reached very seldom and in very specific instances. I have yet to ever see any drive reach maximum performance during true transfer testing of files, although other tests have demonstrated this.