

PCMARK 8 EXTENDED STORAGE WORKLOAD
For one of our last bbenchmarks, we have decided to use PCMark 8 Extended Storage Workload in order to determine steady-state throughput of the SSD. This software is the longest in our battery of tests and takes just under 18 hours per SSD. As this is a specialized component of PCMark 8 Professional, its final result is void of any colorful graphs or charts typical of the normal online results and deciphering the resulting excel file into an easily understood result takes several more hours.
There are 18 phases of testing throughout the entire run, 8 runs of the Degradation Phase, 5 runs of the Steady State Phase and 5 runs of the Recovery Phase. In each phase, several performance tests are run of 10 different software programs; Adobe After Effects, Illustrator, InDesign, Photoshop Heavy and Photoshop Light, Microsoft Excel, PowerPoint and Word, as well as Battlefield 3 and World of Warcraft to cover the gaming element.
- PRECONDITIONING -The entire SSD is filled twice sequentially with random data of a 128KB file size. The second run accounts for overprovisioning that would have escaped the first;
- DEGRADATION PHASE – The SSD is hit with random writes of between 4KB and 1MB for 10 minutes and then a single pass performance test is done of each application. The cycle is repeated 8 times, and with each time, the duration of random writes increases by 5 minutes;
- STEADY STATE PHASE – The drive is hit with random writes of between 4KB and 1MB for 45 minutes before each application is put through a performance test. This process is repeated 5 times;
- RECOVERY PHASE – The SSD is allowed to idle for 5 minutes before and between performance tests of all applications. This is repeated 5 times which accounts for garbage collection; and
- CLEANUP – The entire SSD is written with zero data at a write size of 128KB
In reading the results, the Degrade and Steady State phases represent heavy workload testing while the recovery phase represents typical consumer light workload testing.
As you can see, performance is recorded in terms of Bandwidth and Latency. Bandwidth (or throughput) represents the total throughput the drive is able to sustain during the tests during each phase. Latency, at least for the purposes of PCMark 8, takes on a different outlook and for this, we will term it ‘Total Storage Latency’. Typically, latency has been addressed as the time it takes for a command to be executed, or rather, the time from when the last command completed to the time that the next command started. This is shown below as ‘Average Latency’.
PCMark 8 provides a slightly different measurement, however, that we are terming as ‘Total Storage Latency’. This is represented as being the period from the time the last command was completed until the time it took to complete the next task; the difference, of course, is that the execution of that task is included in ‘Total Storage Latency’. For both latency graphs, the same still exists where the lower the latency, the faster the responsiveness of the system will be. While both latency charts look very similar, the scale puts into perspective how just a few milliseconds can increase the length of time to complete multiple workloads.
For a more in-depth look at Latency, Bandwidth, and IOPS check out our primer article on them here.
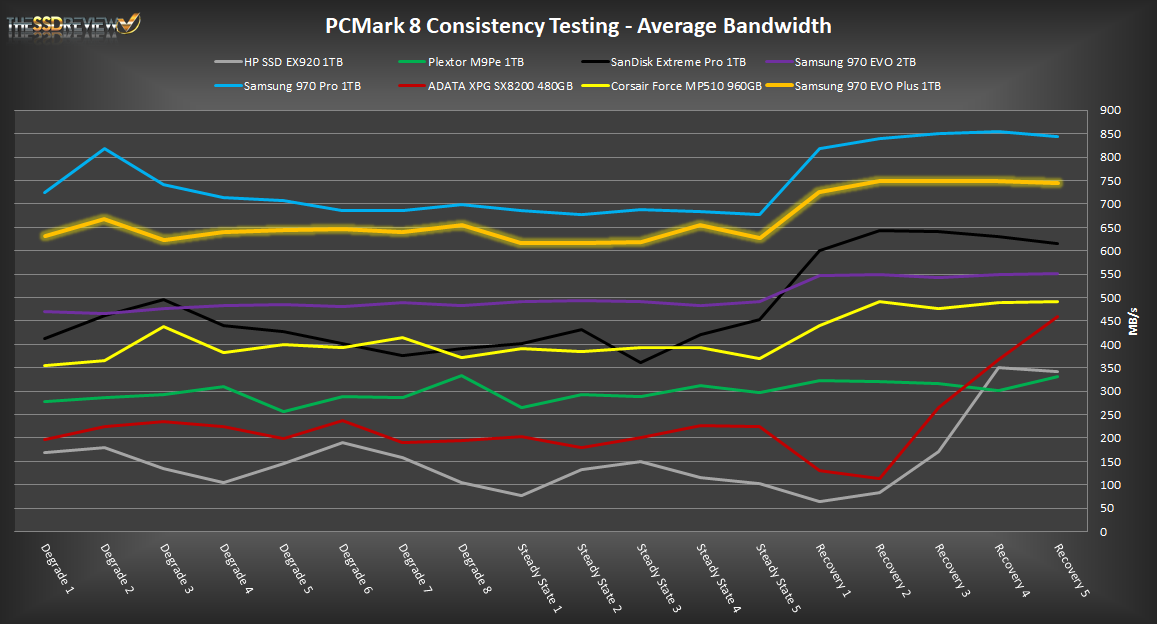
AVERAGE BANDWIDTH (OR THROUGHPUT)
These results show the total average bandwidth across all tests in the 18 phases. In this graph the higher the result the better.
AVERAGE LATENCY (OR ACCESS TIME)
These results show the average access time during the workloads across all tests in the 18 phases. In this graph the lower the result the better.
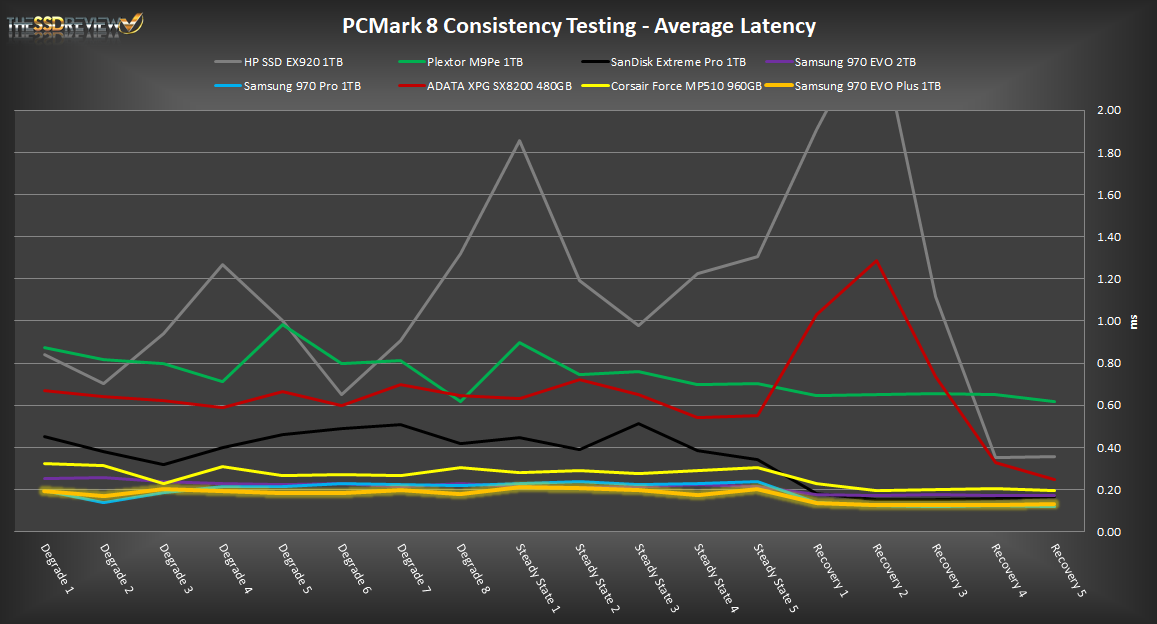
Remembering that this is the EVO line of SSDs, intended as a value point for the consumer, the 1TB version of the Samsung EVO Plus just gave us the lowest latency we amongst many premium SSDs, as well as the second highest average bandwidth. This is no less than impressive.
REAL WORLD FILE TRANSFER
For our Real World File Transfer Comparison of the worlds top M.2 NVMe SSDs, we have included the Samsung 970 Pro, SanDisk Extreme Pro & WD Black 1TB NVMe SSDs, Toshiba XG6, Samsung 960 Pro, and Samsung 970 EVO, in our testing of Samsung’s newest 970 EVO Plus 1TB and 250GB M.2 NVMe SSDs. This test is conducted through the transfer of data from one spot on the test drive to another to give us the truest of transfer speed results for that device.
 When we look at the placement of the two Samsung 970 EVO Plus NVMe M.2 SSDs on this chart, we can see right off that they are with good company. First off, the 1TB EVO Plus could very well be moved to the second spot ahead of the SansDisk Extreme Pro if you were just examining the video, music and picture transfers. It was simply the OS transfer that held things back. If we only considered the 250GB 970 EVO Plus, we could probably agree on the fact that it shouldn’t even be here, simply because the capacity is too small.
I recently bought the 970 Evo 500GB, but haven’t used it yet, and it’s still in the window of time to return it. I’m considering returning it and getting the Plus 500GB. Are there any areas where the previous 970 is better than the Plus ?
Sorry…no. The Plus is an amazing SSD.
Just wondering would the 1TB 970 Plus best my relatively new 970 Pro in terms of overall read/write performance?
If only their QLC drives were that good 🙂
Hello, What are actual NAND erase block and NAND page sizes? 1536kb/8kb or different?