

ANVIL STORAGE UTILITIES PROFESSIONAL
Anvil’s Storage Utilities (ASU) is the most complete set of tests available for the solid state drive today. The benchmark displays not only throughput test results, but also for IOPS and disk access times. Not only does Anvil Storage Utilities incorporate a preset SSD benchmark, but also includes the ability to perform endurance testing and threaded I/O read/write/mixed tests. All of these are simple to understand and use.
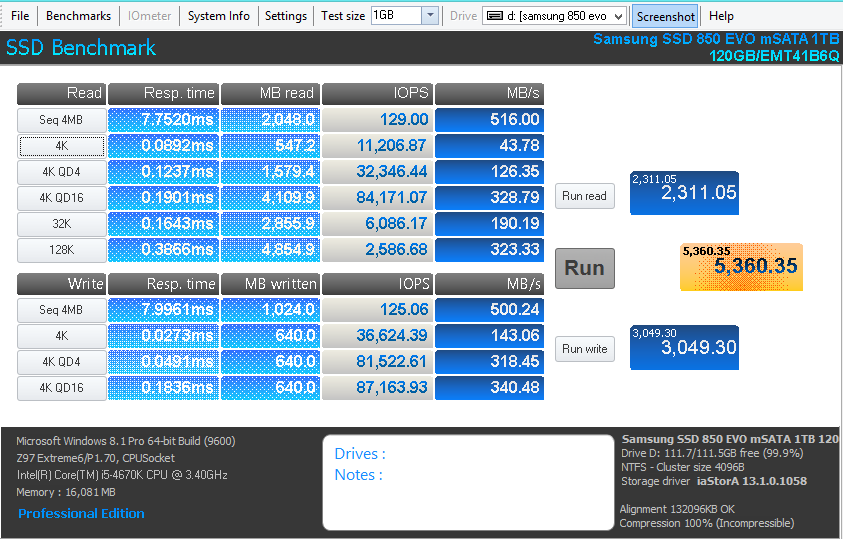
The Anvil Storage Utilities testing pretty much mirrors the results we are seeing in our previous benchmarks. Random 4K reads peaked at a little over 84,000 IOPS, and random4K writes peaked at a little over 87,000 IOPS. Sequential reads of 516MB/s and sequential writes of 500MB/s reinforce our previous results. A total score of 5360 makes this drive a top-tier SSD.
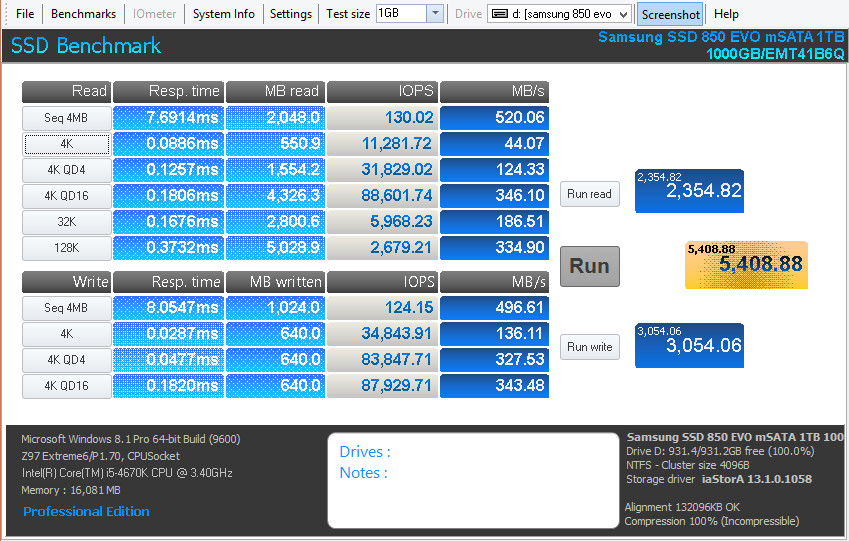
The 1TB mSATA 850 EVO showed slightly better random 4K speeds than the 120GB version, with reads of a little over 88,000 IOPS and writes bumping right up to 88,000 IOPS. The 1TB version is showing its performance consistency, and attains sequential reads of 520MB/s and sequential writes of 496MB/s. The total score of 5408 again shows that the 1TB mSATA 850 EVO is a top-tier SSD.
Iometer is an I/O subsystem measurement and characterization tool for single and clustered systems. It was originally developed by the Intel Corporation, however they discontinued work on the program. In 2003 it was re-launched by an international group of individuals who are now continuously improving, porting and extending the product that is now widely used within the industry.
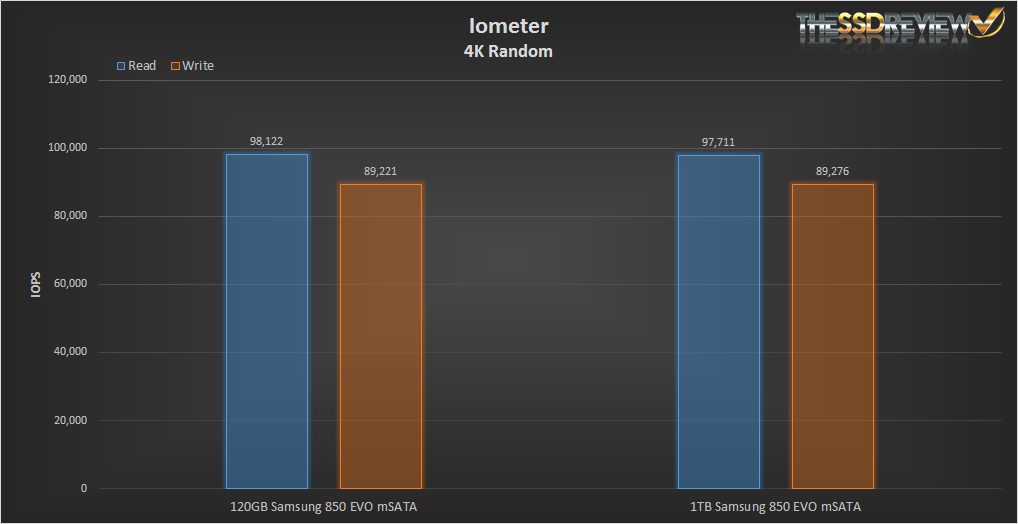
Our Iometer testing showed nearly identical results for both capacities of mSATA 850 EVO that we tested. The read speeds were less than 500 IOPS apart, with the 120GB model peaking at 98,122 IOPS and the 1TB model peaking at 97,711 IOPS. The write speeds were only separated by a mere 55 IOPS, with the 120GB peaking at 89,221 IOPS and the 1TB model peaking at 89,276 IOPS. The Iometer testing again shows the consistency of performance of these mSATA 850 EVO SSDs.
The SSD Review uses benchmark software called PCMark Vantage x64 HDD Suite to create testing scenarios that might be used in the typical user experience. There are eight tests in all and the tests performed record the speed of data movement in MB/s to which they are then given a numerical score after all of the tests are complete. The simulations are as follows:
Windows Defender In Use
- Streaming Data from storage in games such as Alan Wake which allows for massive worlds and riveting non-stop action
- Importing digital photos into Windows Photo Gallery
- Starting the Vista Operating System
- Home Video editing with Movie Maker which can be very time consuming
- Media Center which can handle video recording, time shifting and streaming from Windows media center to an extender such as Xbox
- Cataloging a music library
- Starting applications
PCMARK VANTAGE RESULTS 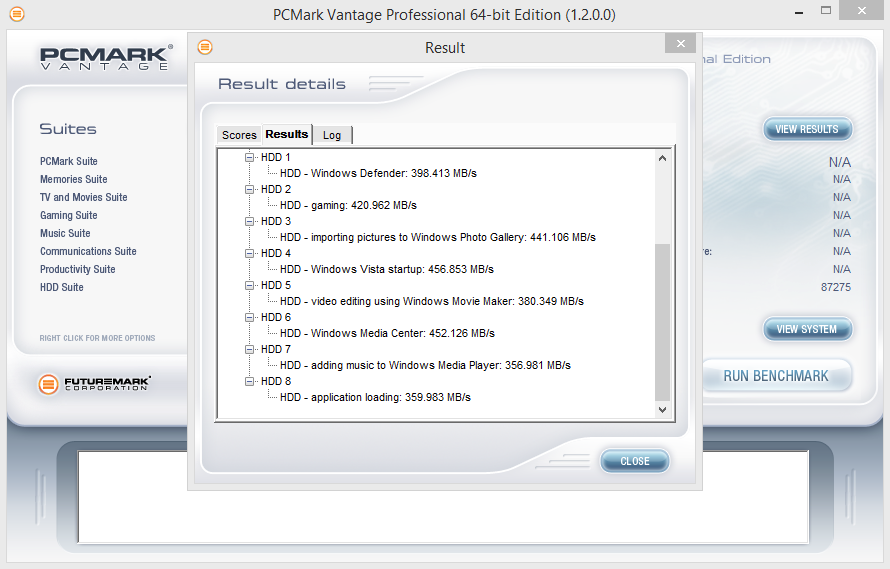
The 120GB mSATA 850 EVO was fastest in the Windows Vista startup and Windows Media Center phases of the testing, besting 450MB/s in both phases. The “slowest” performance came while “adding music to Windows Media Player”, at just under 357MB/s. The total score of 87,275 again is an upper-tier result.
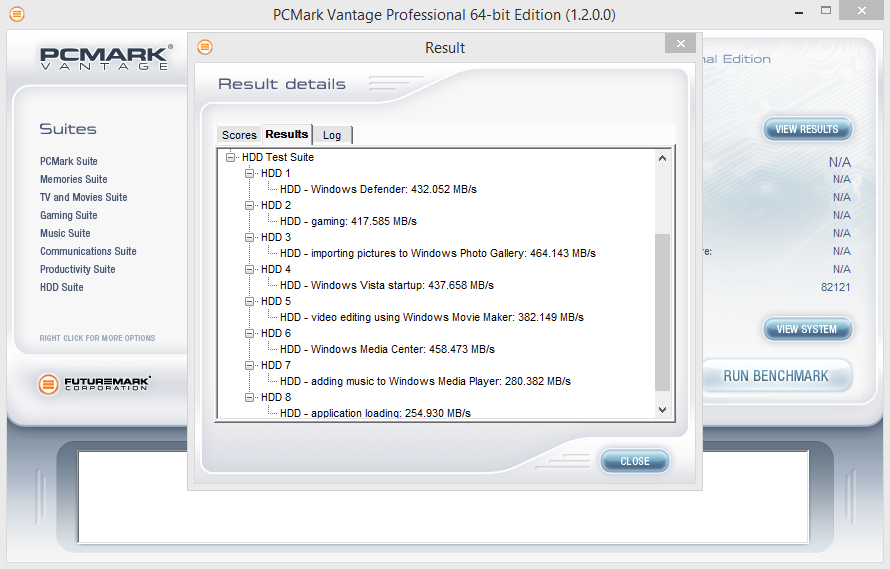
With the 1TB mSATA 850 EVO, the fastest results were with “importing pictures to Windows Photo Gallery” at over 464MB/s, and the “slowest” result was for application loading, dropping down to just under 255MB/s. Comparing to the 120GB version, the test-by-test comparisons are a bit of a mixed bag of pluses and minuses, resulting in a slightly lower overall score of 82,121. This is still an upper-tier overall result and total score.
For our last benchmark, we have decided to use PCMark 8 Extended Storage Workload in order to determine steady state throughput of the SSD. This software is the longest in our battery of tests and takes just under 18 hours per SSD. As this is a specialized component of PCMark 8 Professional, its final result is void of any colorful graphs or charts typical of the normal online results and deciphering the resulting excel file into an easily understood result takes several more hours.
There are 18 phases of testing throughout the entire run, 8 runs of the Degradation Phase, 5 runs of the Steady State Phase and 5 runs of the Recovery Phase. In each phase, several performance tests are run of 10 different software programs; Adobe After Effects, Illustrator, InDesign, Photoshop Heavy and Photoshop Light, Microsoft Excel, PowerPoint and Word, as well as Battlefield 3 and World of Warcraft to cover the gaming element.
- PRECONDITIONING -The entire SSD is filled twice sequentially with random data of a 128KB file size. The second run accounts for overprovisioning that would have escaped the first;
- DEGRADATION PHASE – The SSD is hit with random writes of between 4KB and 1MB for 10 minutes and then a single pass performance test is done of each application. The cycle is repeated 8 times, and with each time, the duration of random writes increases by 5 minutes;
- STEADY STATE PHASE – The drive is hit with random writes of between 4KB and 1MB for 45 minutes before each application is put through a performance test. This process is repeated 5 times;
- RECOVERY PHASE – The SSD is allowed to idle for 5 minutes before and between performance tests of all applications. This is repeated 5 times which accounts for garbage collection; and
- CLEANUP – The entire SSD is written with zero data at a write size of 128KB
In reading the results, the Degrade and Steady State phases represent heavy workload testing while the recovery phase represents typical consumer light workload testing.
As you can see, performance is recorded in terms of Bandwidth and Latency. Bandwidth (or throughput) represents the total throughput the drive is able to sustain during the tests during each phase. Latency, at least for the purposes of PCMark 8, takes on a different outlook and for this, we will term it ‘Total Storage Latency’. Typically, latency has been addressed as the time it takes for a command to be executed, or rather, the time from when the last command completed to the time that the next command started. This is shown below as ‘Average Latency’.
PCMark 8 provides a slightly different measurement, however, that we are terming as ‘Total Storage Latency’. This is represented as being the period from the time the last command was completed, until the time it took to complete the next task; the difference of course being that the execution of that task is included in ‘Total Storage Latency’. For both latency graphs, the same still exists where the lower the latency, the faster the responsiveness of the system will be. While both latency charts look very similar, the scale puts into perspective how just a few milliseconds can increase the length of time to complete multiple workloads.
For a more in-depth look into Latency, Bandwidth, and IOPS check out our primer article on them here.
Our comparison group for the PCMark 8 testing includes the following SSDs: Adata SP900 M.2 256GB, Kingston SM2280S3 240GB, Samsung 850 EVO (2.5″) 120GB, Samsung 850 EVO (2.5″) 1TB, Samsung 850 EVO M.2 120GB, Samsung 850 EVO mSATA 120GB, and Samsung 850 EVO mSATA 1TB.
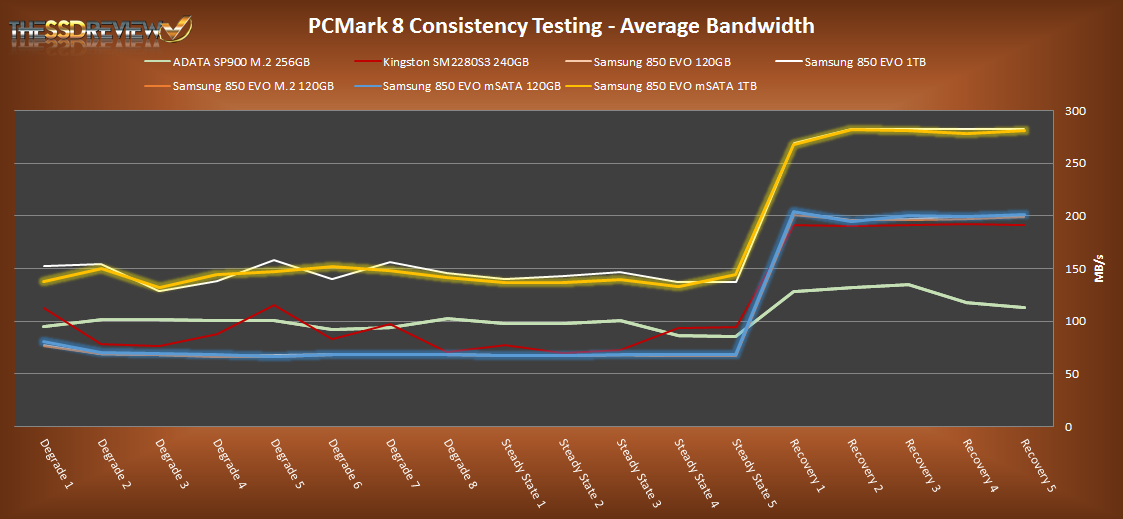
AVERAGE BANDWIDTH (OR THROUGHPUT)
These results show the total average bandwidth across all tests in the 18 phases. In this graph the higher the result the better.
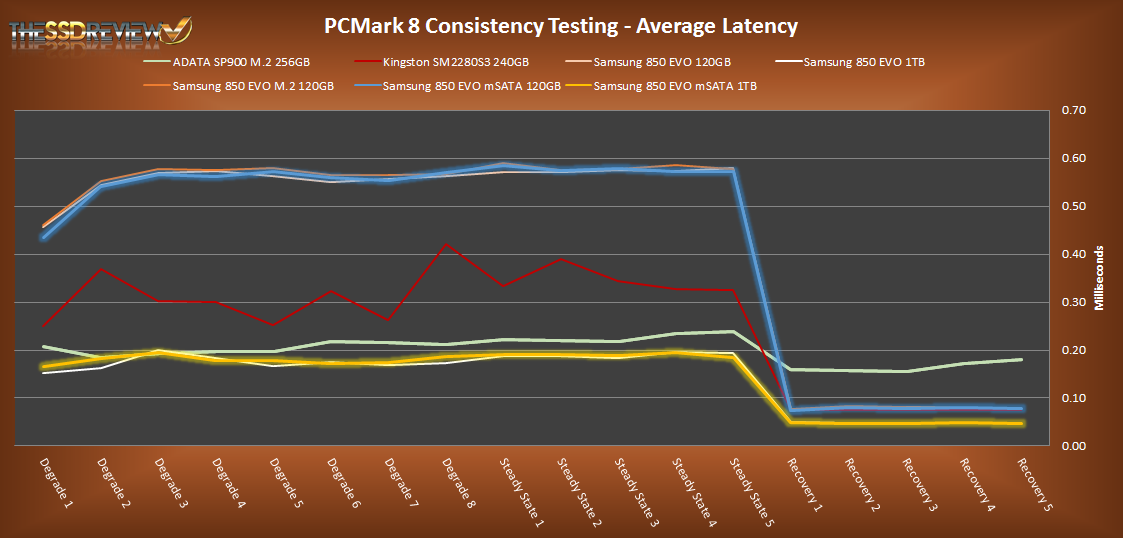
AVERAGE LATENCY (OR ACCESS TIME)
These results show the average access time during the workloads across all tests in the 18 phases. In this graph the lower the result the better.
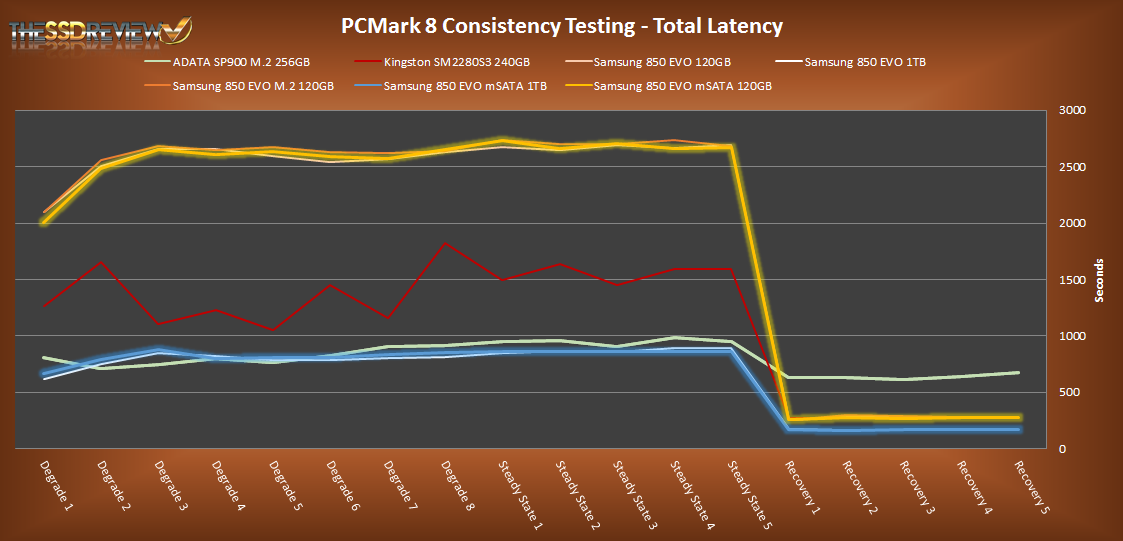
TOTAL STORAGE LATENCY
These results show the total access time across all tests in the 18 phases. In this graph the lower the result the better.
The Samsung mSATA 850 EVOs show very strong results in our PCMark 8 testing. The graph lines for all form factors of the 850 EVOs are nearly identical, both in performance and consistency. The 120GB models share similar graph trajectories in both the “degrade” and “steady state” portions of the testing, and merge to virtually a single shared trajectory in the “recovery” phase of the testing. The 1TB mSATA version of the 850 EVO shows its performance consistency, with less spikes in the “degrade” and “steady state” phases, before merging into a single shared trajectory with the other 850 EVO form factors in the “recovery” phase. The PCMark 8 testing reinforces the excellent consistency and performance of these drives that we have seen in our other benchmarks.
It would appear, thus far that the Kingston HyperX Predator M.2 SSD. Is that a safe assumption?
Of course I’m only asking this because I purchased the Predator secondary to your stellar review last week!
Hi, Thanks for the comment!
Unfortunately, I’m not quite sure what your question is. You mentioned the HyperX Predator, so I’m assuming you’re comparing that to the drive in this report.
While both drives are very good and have their uses, they can’t be compared 1-1 as the Samsung 850 drive in this report is is an MSATA, which is meant primarily for use in mobile devices such a ultrabooks and tablets, etc. The Kingston drive is an M.2 PCIe SSD which is meant for use in desktop environments where either a full on PCI Express 3.0 or M.2 slot is available.
Both drives are also priced differently as well, which further places them at different sections of the market.
Again, we appreciate your feedback and hope we were able to answer your questions and provide helpful information.
Thanks for the reply Donny. With the recent release of the Intel PCIe ssd, I’m just wondering whether I should have waited to buy the Kingston HyperX Predator!
With a Samsung EVO 850 500Gb mSATA SSD, I tested “Rapid Mode” from Samsung Magician v4.9 on a HP Z15 laptop (i7-4700MQ 3.2 Ghz – Windows 7 x64). Using ATTO v3.05 to benchmark. I had a solid 548mb read / 420 Mb write starting at 32kb all the way to 64Mb whereas with rapid mode on, it peaked at 562Mb read / 478 write at 1Mb file size then went down from there – by 64Mb was 373 read / 304 write! Of course to fully understand the stats, you need to see the results bar graphs but wow…rapid nerf performance is really what “rapid mode” does! And as another article on this site about rapid mode proves that Windows already does a good job at caching and I am good with that! https://www.dropbox.com/sh/hyv8zgjl45lyf2d/AAD0Juvw7aIBWJ_IV_3l5b0Ga?dl=0
Please HELP with this question:
I have a samsung ativ book 9 (ultrabook) that has an internal 128GB ssd that is also a msata. I also have the samsung EXTERNAL 500GB msata ssd. I was wondering if I can open the external ssd cover and switch the ssd with the one inside my lapotop so I can upgrade the memory from 128 to 500GB. Is this possible? Thanks.