
The SSD Review uses benchmark software called PCMark Vantage x64 HDD Suite to create testing scenarios that might be used in the typical user experience. There are eight tests in all and the tests performed record the speed of data movement in MB/s to which they are then given a numerical score after all of the tests are complete. The simulations are as follows:
- Windows Defender In Use
- Streaming Data from storage in games such as Alan Wake which allows for massive worlds and riveting non-stop action
- Importing digital photos into Windows Photo Gallery
- Starting the Vista Operating System
- Home Video editing with Movie Maker which can be very time-consuming
- Media Center which can handle video recording, time shifting and streaming from Windows media center to an extender such as Xbox
- Cataloging a music library
- Starting applications
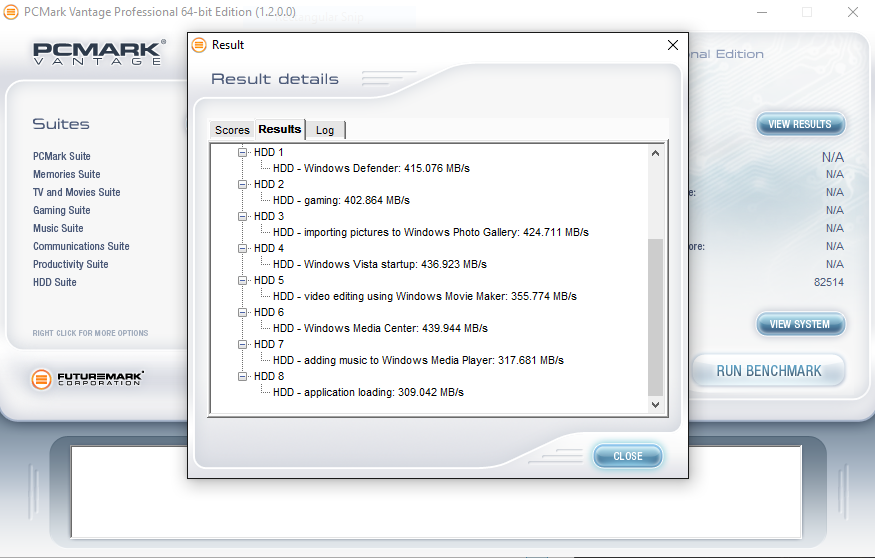
PCMARK VANTAGE RESULTS
120GB
250GB
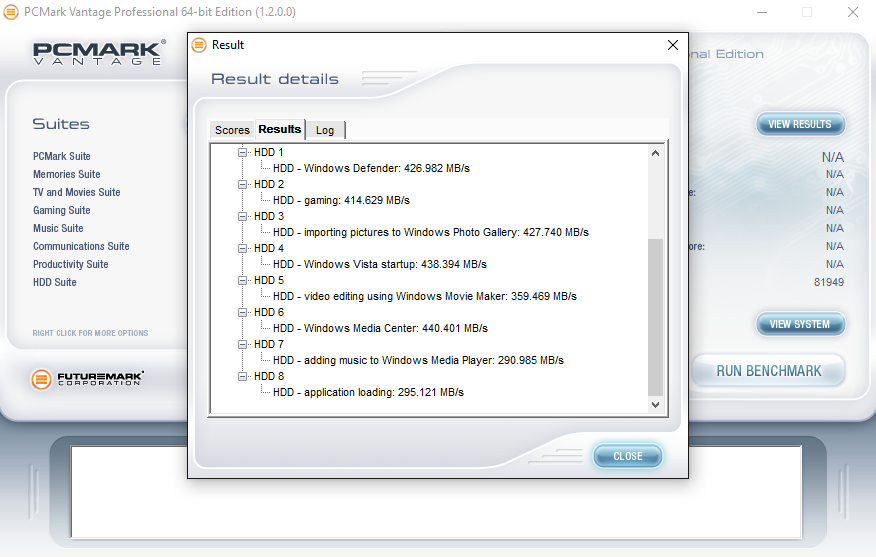
Both of the Samsung 750 EVO drives return a final score exceeding 81,000, with the 120GB capacity exceeding the 250GB by nearly 1400 points. Both drives performed best when using Windows Media Centre.
For our last benchmark, we have decided to use PCMark 8 Extended Storage Workload in order to determine steady state throughput of the SSD. This software is the longest in our battery of tests and takes just under 18 hours per SSD. As this is a specialized component of PCMark 8 Professional, its final result is void of any colorful graphs or charts typical of the normal online results and deciphering the resulting excel file into an easily understood result takes several more hours.
There are 18 phases of testing throughout the entire run, 8 runs of the Degradation Phase, 5 runs of the Steady State Phase and 5 runs of the Recovery Phase. In each phase, several performance tests are run of 10 different software programs; Adobe After Effects, Illustrator, InDesign, Photoshop Heavy and Photoshop Light, Microsoft Excel, PowerPoint and Word, as well as Battlefield 3 and World of Warcraft to cover the gaming element.
- PRECONDITIONING -The entire SSD is filled twice sequentially with random data of a 128KB file size. The second run accounts for overprovisioning that would have escaped the first;
- DEGRADATION PHASE – The SSD is hit with random writes of between 4KB and 1MB for 10 minutes and then a single pass performance test is done of each application. The cycle is repeated 8 times, and with each time, the duration of random writes increases by 5 minutes;
- STEADY STATE PHASE – The drive is hit with random writes of between 4KB and 1MB for 45 minutes before each application is put through a performance test. This process is repeated 5 times;
- RECOVERY PHASE – The SSD is allowed to idle for 5 minutes before and between performance tests of all applications. This is repeated 5 times which accounts for garbage collection; and
- CLEANUP – The entire SSD is written with zero data at a write size of 128KB
In reading the results, the Degrade and Steady State phases represent heavy workload testing while the recovery phase represents typical consumer light workload testing.
As you can see, performance is recorded in terms of Bandwidth and Latency. Bandwidth (or throughput) represents the total throughput the drive is able to sustain during the tests during each phase. Latency, at least for the purposes of PCMark 8, takes on a different outlook and for this, we will term it ‘Total Storage Latency’. Typically, latency has been addressed as the time it takes for a command to be executed, or rather, the time from when the last command completed to the time that the next command started. This is shown below as ‘Average Latency’.
PCMark 8 provides a slightly different measurement, however, that we are terming as ‘Total Storage Latency’. This is represented as being the period from the time the last command was completed, until the time it took to complete the next task; the difference of course being that the execution of that task is included in ‘Total Storage Latency’. For both latency graphs, the same still exists where the lower the latency, the faster the responsiveness of the system will be. While both latency charts look very similar, the scale puts into perspective how just a few milliseconds can increase the length of time to complete multiple workloads.
For a more in-depth look into Latency, Bandwidth, and IOPS check out our primer article on them here.
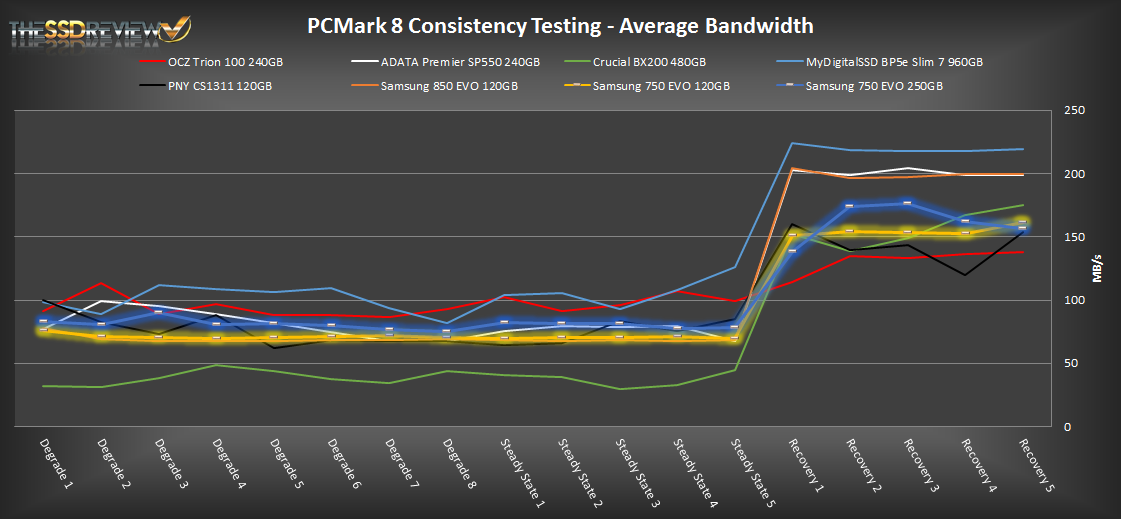
AVERAGE BANDWIDTH (OR THROUGHPUT)
These results show the total average bandwidth across all tests in the 18 phases. In this graph the higher the result the better.
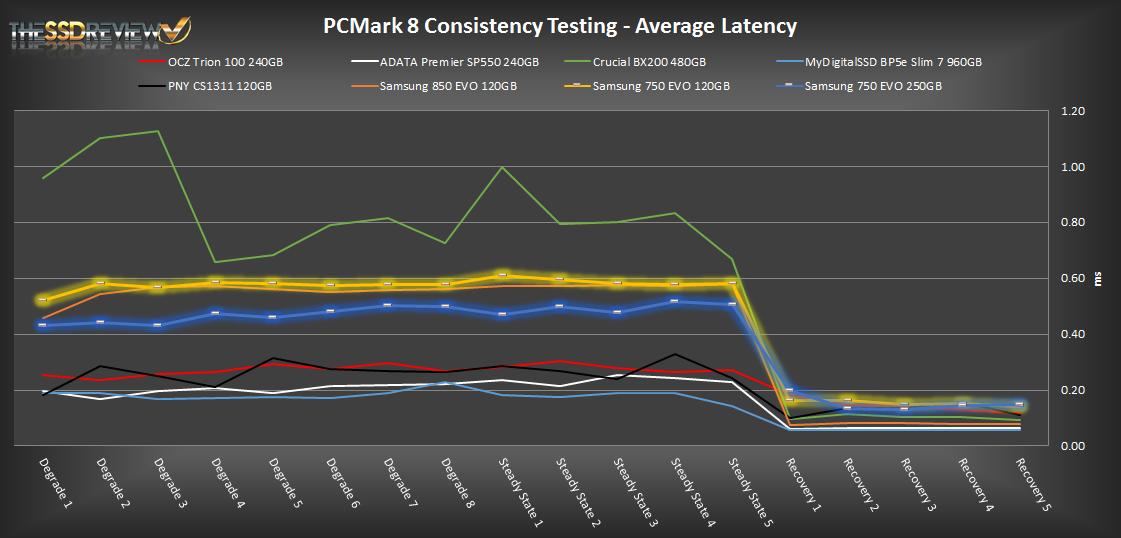
AVERAGE LATENCY (OR ACCESS TIME)
These results show the average access time during the workloads across all tests in the 18 phases. In this graph the lower the result the better.
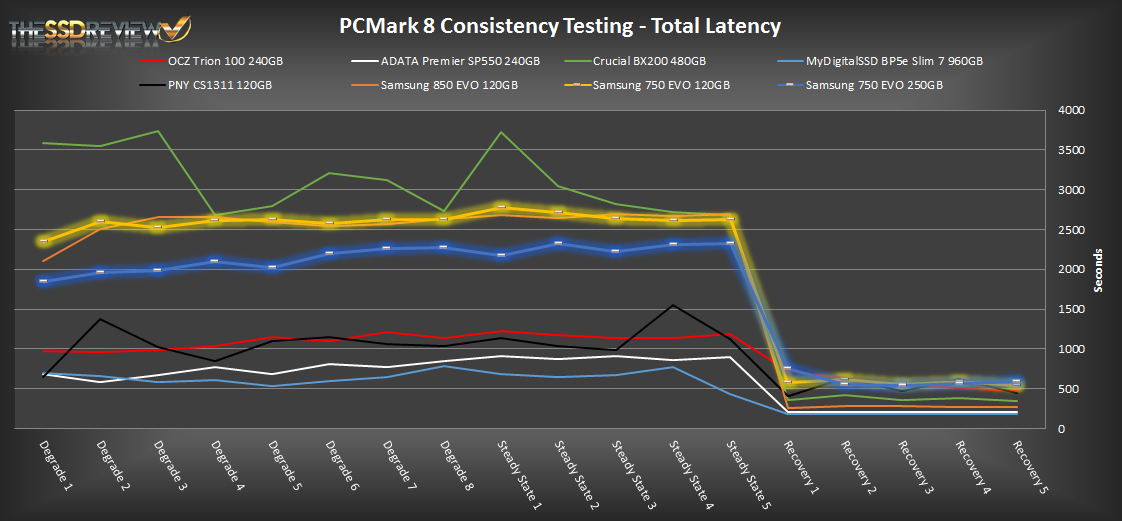
TOTAL STORAGE LATENCY
These results show the total access time across all tests in the 18 phases. In this graph the lower the result the better.
As we can see above, while the 250GB capacity beats out the 120GB when it comes to throughput, the same can be said when it comes to latency. Across both average and total latency, the 250GB was just ‘that’ much better than the 120GB capacity.
Which one is the 256MB DRAM chip? I saw a controller, two NAND package(one on each side), and one small chip which Iooks like power management chip.
dram is integrated into controller on 750 EVO.
“The 750 EVO also crams a 256MB DDR3 memory module in the same package as the MGX controller, which should reduce latency between the processor and its DRAM buffer. This is the first time we’ve seen the advanced design in a Samsung SSD.”
Wow, thats pretty mad. Although not unheard of. Mobile SoCs were using something like this for years.
They should release 650 for consumers. Would perform a little bit worse (due to lack of dram) but would probobly be priced lower aswell. Perfect for those seeking the cheapest thing possible.
Honestly, we would love to see this drive released to consumers. It’s priced very well and you get decent SATA III performance out of it. Never mind the fact that you can through it in RAPID mode through Samsung Magician as well.
rapid is just a pointless gimmick, nothing else.
It’s still an added feature, consider it what you like. Regardless, the point being that the 750 really should be a consumer driver
You want Cheaper? Buy chalk and a board?
Sarcasm aside (my bad); try run a profitable business for a year.
Samsung is a _big_ company, so i’m sure it can afford to sell cheap entry level SSDs for minimal margin.
Beside, Sammy is vertically integrated, so per unit they probably have the lowest cost (having your own fabs, controller and firmware knowhow does have its benefits).
Hello,
What was your average temperature during tests ?
I use mine in a Lenovo G580,and my average temperature is 45degrees,sometimes it goes up to 50.
Is it normal?
Thank you!
IDK, but 850 offers thermal guard which alters the system’s temperature when it reaches a certain degree
Which is best of 850 and 750?? Both with 250gb.
DIFFERENCE BTWEEN THEM is that 850 has 1 gb of Ddr3 while 750 has 256mb of DDR3. 850 also offers dynamic thermal guard, which alters the system temperature when it reaches a certain degree, and it has 3d VNAD (only useful for high capacity ssds, as 2D Nand can only reach up to 250gb. 750 offers 2d NAND. Speed difference is minimal
Nice article … of course BUT
Your tests are not valid, you did speed test on 256MB ! and 1GB file size.
First one is exactly size of dram inside SSD.
Valid test should be on 16GB or more.
It’s already available for consumers. You can buy it from ebay. (current price $75 for 250GB)
I got one yesterday. 250Gb; under $65 where I live.
nice bargain
I dont like having an ssd that dont compress as my main C drive. It’s fine for a dedicated game drive and such, but as a drive that houses Windows I would never use a Samsung drive. In just a month (after a clean install) Windows 10 and Chrome had written half a terabyte on my 850 evo and that’s just light usage. A controller that compresses all this junk, such as Sandforce, will have considerably lower writes on them. That’s a good thing.
I have used this drive on my i3 laptop and it can only reach 250 read and write due to it being sata 2