
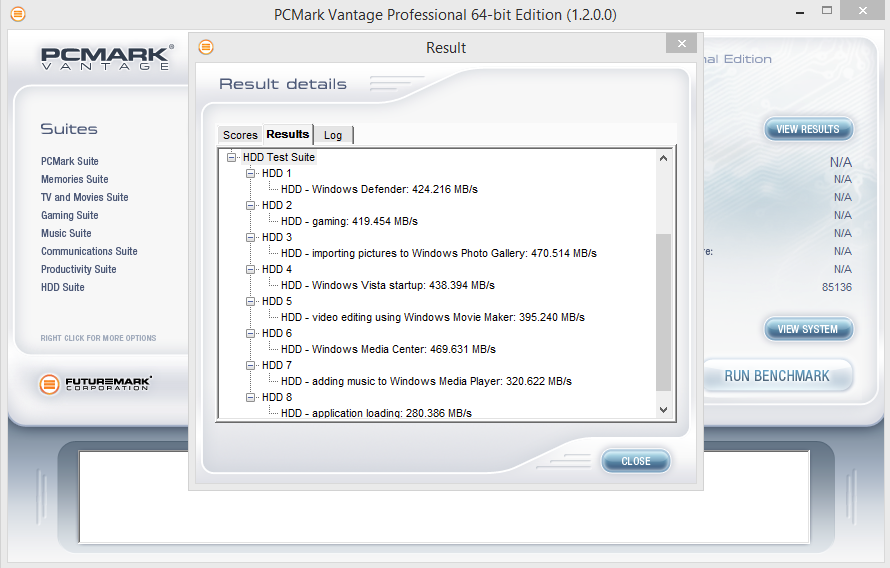
The SSD Review uses benchmark software called PCMark Vantage x64 HDD Suite to create testing scenarios that might be used in the typical user experience. There are eight tests in all and the tests performed record the speed of data movement in MB/s to which they are then given a numerical score after all of the tests are complete. The simulations are as follows:
- Windows Defender In Use
- Streaming Data from storage in games such as Alan Wake which allows for massive worlds and riveting non-stop action
- Importing digital photos into Windows Photo Gallery
- Starting the Vista Operating System
- Home Video editing with Movie Maker which can be very time consuming
- Media Center which can handle video recording, time shifting and streaming from Windows media center to an extender such as Xbox
- Cataloging a music library
- Starting applications
PCMARK VANTAGE RESULTS
PNY’s CS2111 XLR8 did very well in our PCMark Vantage Benchmark. It achieved a Total Score of 85,136 points. The highest transfer speed of 470MB/s was recorded during the “Windows Media Center” benchmark. The lowest of 280MB/s was recorded during the “application loading” benchmark, which isn’t surprising when you compare this result to the AS SSD copy benchmarks from earlier. Overall, this SSD is proving to be quite competitive. Let’s continue on to our PCMark 8 test and see how it fares.
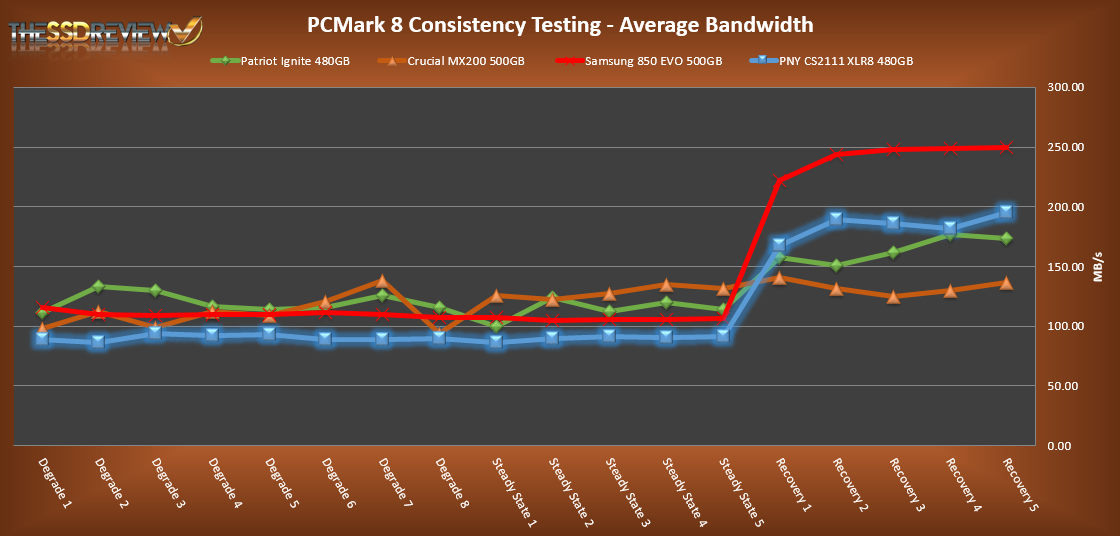
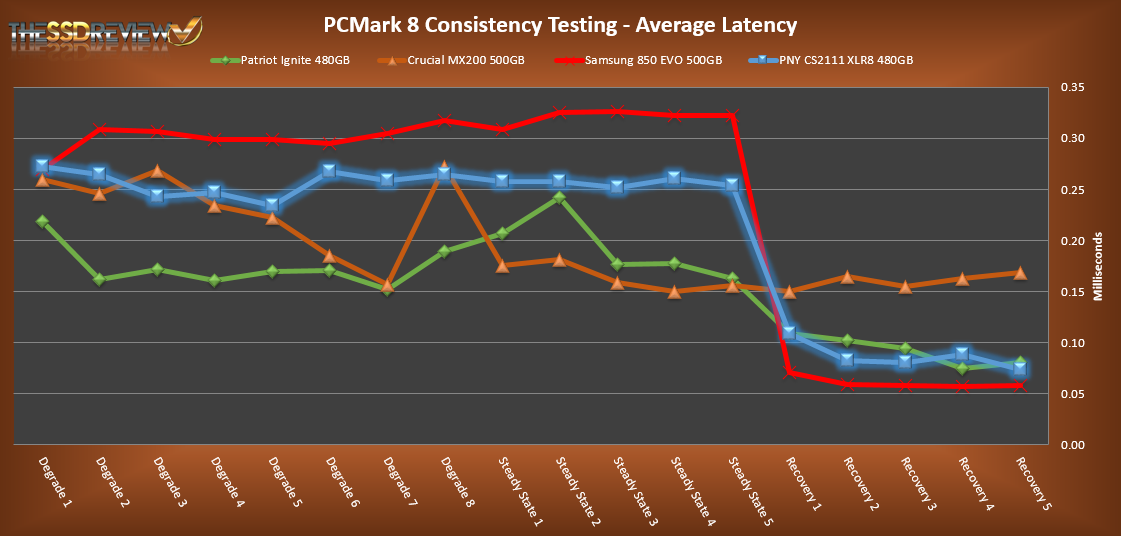
For our last benchmark, we have decided to use PCMark 8 Extended Storage Workload in order to determine steady state throughput of the SSD. This software is the longest in our battery of tests and takes just under 18 hours per SSD. As this is a specialized component of PCMark 8 Professional, its final result is void of any colorful graphs or charts typical of the normal online results and deciphering the resulting excel file into an easily understood result takes several more hours.
There are 18 phases of testing throughout the entire run, 8 runs of the Degradation Phase, 5 runs of the Steady State Phase and 5 runs of the Recovery Phase. In each phase, several performance tests are run of 10 different software programs; Adobe After Effects, Illustrator, InDesign, Photoshop Heavy and Photoshop Light, Microsoft Excel, PowerPoint and Word, as well as Battlefield 3 and World of Warcraft to cover the gaming element.
- PRECONDITIONING -The entire SSD is filled twice sequentially with random data of a 128KB file size. The second run accounts for overprovisioning that would have escaped the first;
- DEGRADATION PHASE – The SSD is hit with random writes of between 4KB and 1MB for 10 minutes and then a single pass performance test is done of each application. The cycle is repeated 8 times, and with each time, the duration of random writes increases by 5 minutes;
- STEADY STATE PHASE – The drive is hit with random writes of between 4KB and 1MB for 45 minutes before each application is put through a performance test. This process is repeated 5 times;
- RECOVERY PHASE – The SSD is allowed to idle for 5 minutes before and between performance tests of all applications. This is repeated 5 times which accounts for garbage collection; and
- CLEANUP – The entire SSD is written with zero data at a write size of 128KB
In reading the results, the Degrade and Steady State phases represent heavy workload testing while the recovery phase represents typical consumer light workload testing.
As you can see, performance is recorded in terms of Bandwidth and Latency. Bandwidth (or throughput) represents the total throughput the drive is able to sustain during the tests during each phase. Latency, at least for the purposes of PCMark 8, takes on a different outlook and for this, we will term it ‘Total Storage latency’. Typically, latency has been addressed as the time it takes for a command to be executed, or rather, the time from when the last command completed to the time that the next command started. This is shown below as ‘Average Latency’.
PCMark 8 provides a slightly different measurement, however, that we are terming as ‘Total Storage Latency’. This is represented as being the period from the time the last command was completed, until the time it took to complete the next task; the difference of course being that the execution of that task is included in ‘Total Storage Latency’. For both latency graphs, the same still exists where the lower the latency, the faster the responsiveness of the system will be. While both latency charts look very similar, the scale puts into perspective how just a few milliseconds can increase the length of time to complete multiple workloads.
For a more in-depth look into Latency, Bandwidth, and IOPS check out our primer article on them here.
AVERAGE BANDWIDTH (OR THROUGHPUT)
These results show the total average bandwidth across all tests in the 18 phases. In this graph the higher the result the better.
AVERAGE LATENCY (OR ACCESS TIME)
These results show the average access time during the workloads across all tests in the 18 phases. In this graph the lower the result the better.
TOTAL STORAGE LATENCY
These results show the total access time across all tests in the 18 phases. In this graph the lower the result the better.
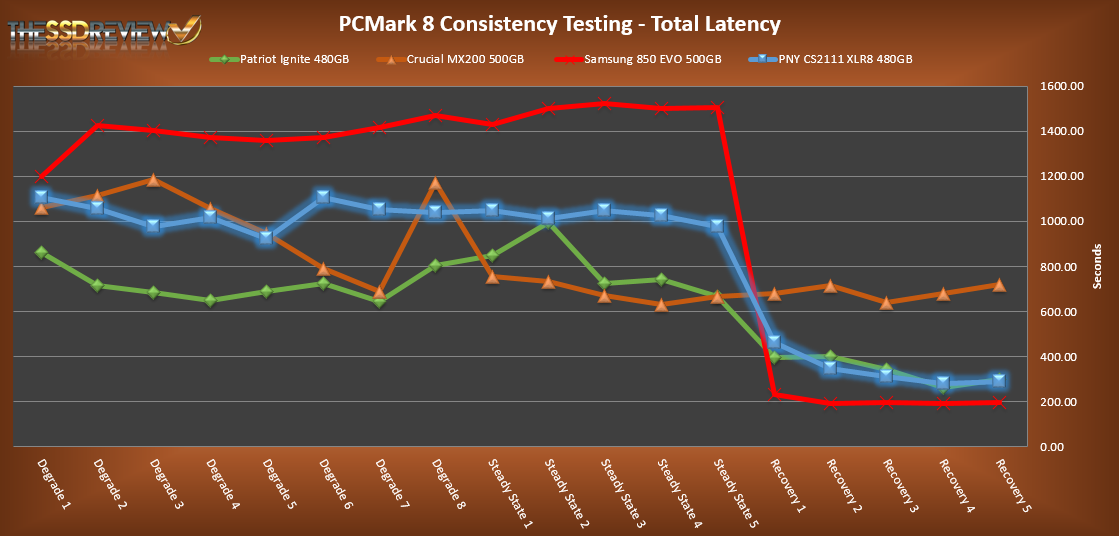
Overall, PCMark 8 performance is decent. We can see that the PNY CS2111 XLR8 performs as that of a mainstream SSD, very comparable to that of the Patriot Ignite, which we just reviewed, in light workload testing. The heavy workload bandwidth performance averages out to just under 100MB/s and latency averages to 0.26ms. Once it gets into the light workload testing, it averages 183MB/s and latency averages 0.09ms.
It would be great if they put their tiger design on a PCIe 3.0 SSD, doubled the DDR3 RAM buffer & abandoned the slow & outdated SATA III Bottleneck.
Is this for real? “with endurance up to 600TB” I mean the Samsung 1TB is like 320TBW. The PNY is 600TBW?!?!?! Seems too good to be true. (I bought one anyways.) 😀
Okay, I got mine in the mail the other week. On the back of the box it says “US: Three-year limited warranty or 600TB written to SSD, whichever occurs first. Europe: Three-year limited warranty.” So that is where the 600TB comes from. MLC NAND flash memory is the best way to go! SIX HUNDRED TB!!! Dang! My drive has been performing fine for the past three weeks. No issues setting it up and it is very fast. I have not benchmarked it yet. Get one! You’ll be glad you did!
Which SSD is better? PNY CS2111 240 GB or Crucial BX100 250 GB?