
For our last benchmark, we have decided to use PCMark 8 Extended Storage Workload in order to determine steady state throughput of the SSD. This software is the longest in our battery of tests and takes just under 18 hours per SSD. As this is a specialized component of PCMark 8 Professional, its final result is void of any colorful graphs or charts typical of the normal online results and deciphering the resulting excel file into an easily understood result takes several more hours.
There are 18 phases of testing throughout the entire run, 8 runs of the Degradation Phase, 5 runs of the Steady State Phase and 5 runs of the Recovery Phase. In each phase, several performance tests are run of 10 different software programs; Adobe After Effects, Illustrator, InDesign, Photoshop Heavy and Photoshop Light, Microsoft Excel, PowerPoint and Word, as well as Battlefield 3 and World of Warcraft to cover the gaming element.
- PRECONDITIONING -The entire SSD is filled twice sequentially with random data of a 128KB file size. The second run accounts for overprovisioning that would have escaped the first;
- DEGRADATION PHASE – The SSD is hit with random writes of between 4KB and 1MB for 10 minutes and then a single pass performance test is done of each application. The cycle is repeated 8 times, and with each time, the duration of random writes increases by 5 minutes;
- STEADY STATE PHASE – The drive is hit with random writes of between 4KB and 1MB for 45 minutes before each application is put through a performance test. This process is repeated 5 times;
- RECOVERY PHASE – The SSD is allowed to idle for 5 minutes before and between performance tests of all applications. This is repeated 5 times which accounts for garbage collection; and
- CLEANUP – The entire SSD is written with zero data at a write size of 128KB
In reading the results, the Degrade and Steady State phases represent heavy workload testing while the recovery phase represents typical consumer light workload testing.
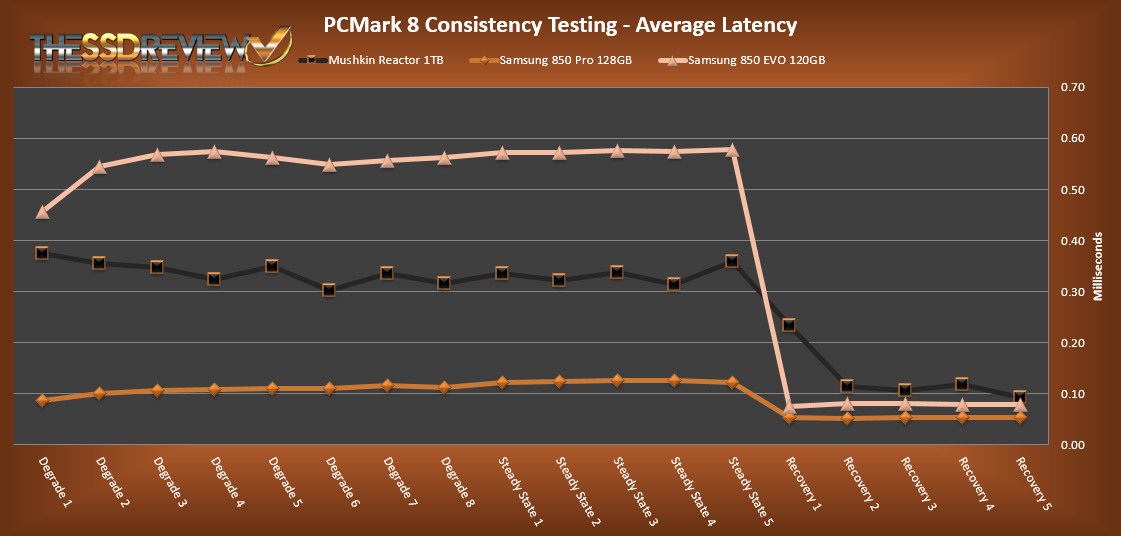
This is the first time we have been able to dive deeper into deciphering our PCMark 8 testing data. As you can see, performance is recorded in terms of Bandwidth and Latency. Bandwidth (or throughput) represents the total throughput the drive is able to sustain during the tests during each phase. Latency, at least for the purposes of PCMark 8, takes on a different outlook and for this, we will term it ‘Total Storage latency’. Typically, latency has been addressed as the time it takes for a command to be executed, or rather, the time from when the last command completed to the time that the next command started. This is shown below as ‘Average Latency’.
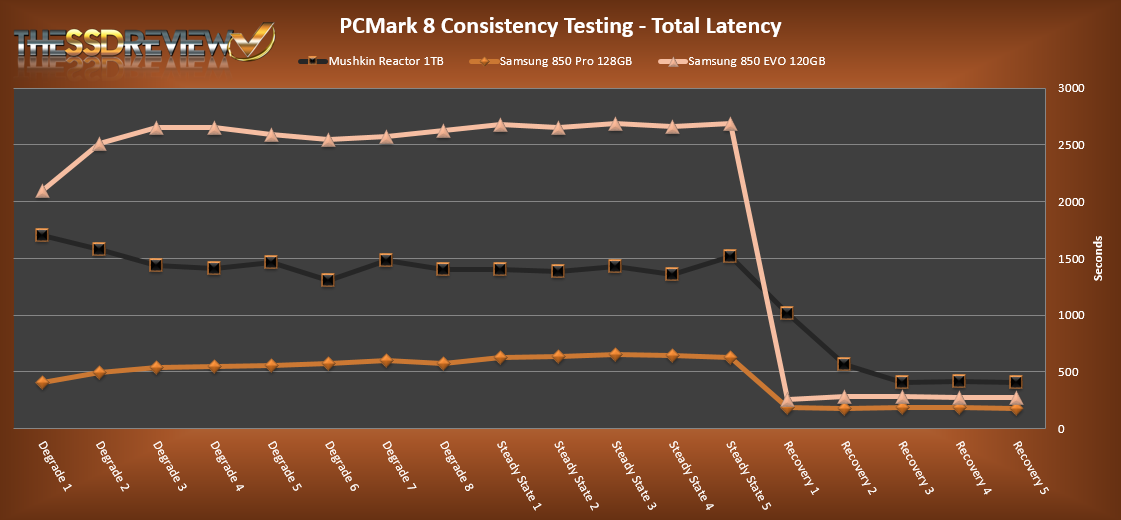
PCMark 8 provides a slightly different measurement, however, that we are terming as ‘Total Storage Latency’. This is represented as being the period from the time the last command was completed, until the time it took to complete the next task; the difference of course being that the execution of that task is included in ‘Total Storage Latency’. For both latency graphs, the same still exists where the lower the latency, the faster the responsiveness of the system will be. While both latency charts look very similar, the scale puts into perspective how just a few milliseconds can increase the length of time to complete multiple workloads.
For a more in-depth look into Latency, Bandwidth, and IOPS check out our primer article on them here.
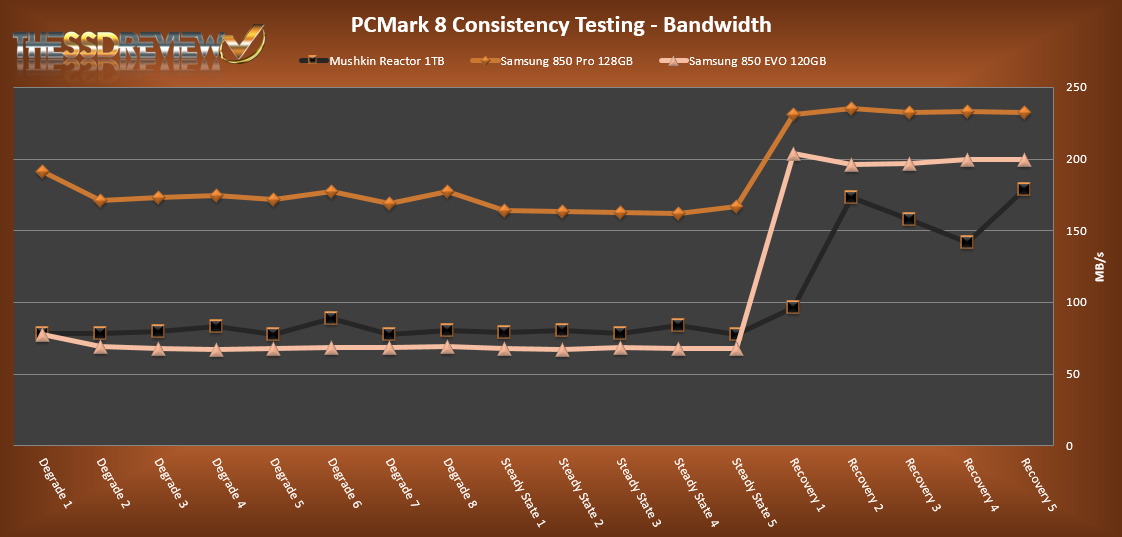
AVERAGE BANDWIDTH (OR THROUGHPUT)
These results show the total average bandwidth across all tests in the 18 phases. In this graph the higher the result the better.
AVERAGE LATENCY (OR ACCESS TIME)
These results show the average access time during the workloads across all tests in the 18 phases. In this graph the lower the result the better.
TOTAL STORAGE LATENCY
These results show the total access time across all tests in the 18 phases. In this graph the lower the result the better.
Looking to the Mushkin Reactor 1TB’s performance we can see that it performs as that of a mainstream SSD in the heavy workload testing, which is expected. The heavy workload bandwidth performance averages out to 80.15MB/s and latency averages to 0.336ms. Once it gets into the light workload testing, it takes a little longer than the Samsung drives to recover. But, once it does, performance is not too far off from the Samsung EVO 120GB for this benchmark. The light workload bandwidth performance averages to 149.76Mb/s and latency drops to an average of 0.135ms.
When looking at the latency of the SSDs under heavy workload, it really puts into perspective that typical synthetic benches don’t always prove real world performance. Benchmarks such as PCMark 8 offer users much better insight into how drives really perform under real world tasks. From this we can see how entry level SSDs truly compare to high end SSDs when it comes to both light and heavy workloads. Even though the SSDs may have similar advertised specifications, it does not mean they can always live up to their advertised specifications in all usage scenarios.
POWER CONSUMPTION
For our power consumption testing, we have the drive connected to the system as a secondary drive. To record the wattage, we use an Amprobe AM-270 multimeter connected in line with the 5v power on our SATA power cable to the drive. The multimeter records the min/max amperage draw from the drive over our testing period.
We also record the drive’s sequential and random read and write power draw using Anvil Storage Utilities. We then take the values recorded and calculate the wattage of the drive. Some of the results may seem high compared to a standard notebook HDD because as these are peak values under load. When we see average power draw, SSDs are still more power efficient because they only hit max power for a short period of time.
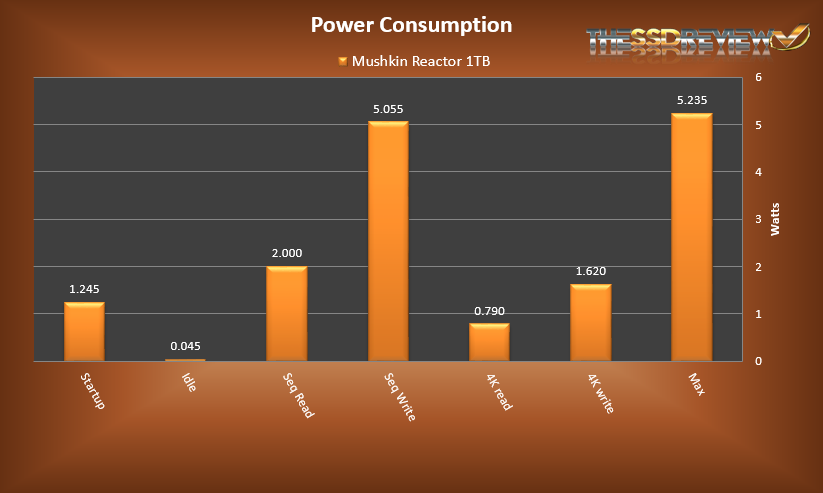
First off, this drive barely even sips power at idle. Only 45mW is consumed. At start up, this drive required 1.245W. During sequential reads the drive will start to consume power at around 2W. However, due to the high amount of NAND packages, this drive starts to engulf power at a rate of 5-5.2W during sequential writes. 4K read and write consumption is much more reserved at .79W during 4K reads and 1.62W during 4K writes.
REPORT ANALYSIS AND FINAL THOUGHTS
Throughout benching, the Mushkin Reactor 1TB has delivered overall good performance. The performance of this SSD is the mark of the SMI SM2246EN controller. ATTO revealed a maximum read speed of 557MB/s and a maximum write speed of 455MB/s. 4K speeds showed to be average, similar to other mainstream drives on the market.
During our PCMark Vantage test, it was able to score a high of 76,104, which puts it in the top 10 of our PCMark Vantage results. Finally, diving deeper into analysis with PCMark 8, we were able to see the drive performed fairly well for a mainstream drive in heavy workloads. Once the recovery phases started, we could see it took a bit longer to recover than the comparison drives, but once it did, performance was much closer to their results.
Finally, power testing revealed very low idle power consumption and 4K read and write consumption is about average of what we see from other drives. However, due to the 16 NAND packages, sequential writes draw around 5W.
The Reactor is a new competitive SSD option form Mushkin and yet another SSD utilizing Silicon Motion’s low cost SM2246EN controller. Pairing it with Micron’s L95B NAND and building the SATA data and power connectors into the PCB has enabled Mushkin to keep the price point of this drive very low. At the current market price of $370, it is the cheapest 1TB option available. But, don’t think that a low price point will result in low performance. This drive is able to still keep up with many of the mainstream drives on the market and does decent in our consistency testing.
Game libraries are growing faster and faster with new titles eating up 30-50GB each. Gamers demand the best load times they can get, but also need capacity to keep up. That is why, with its 1TB capacity and radioactive, nuclear theme, we see the Reactor gaining a lot of traction with the gaming enthusiast crowd. It offers a great value if you are in the market for a new, no frills, high performance and capacity SSD.
Check Out Mushkin Reactor Pricing at Amazon!

Silicon Motion and Phison and doing a good job in recent times.. Competition is a healthy thing and is always beneficiary to us the consumers.
Thank you Sean for the review.
Looks like 16nm flash is available to 3rd parties aswell 🙂
Hopefully price comes down even further, because right now ultra ii is the way to go, if you need 1TB.
is this drive friendly towards mac computers? I need a 1tb ssd for my 2010 Macbook Pro.