
 Testing will be performed on an Asus Maximus IV Gene-Z paired with an Intel Core i5 2500K and 8GB of G.Skill DD3 1866.
Intels Rapid Storage Technology storage drivers version 10.6.0.1002 are used for all testing.
Windows Search and Indexing are enabled, as are Speed Step and Turbo. Stock Sandy Bridge Turbo ratios are for the i5-2500K.

SSD COMPRESSION AND TESTING FLUCTUATIONS
All SSDs are not created equal and many new SSD enthusiasts realize that when they test their new drive to confirm specifications and ensure all is in order. SandForce controlled SSDs, as in the Kingston Hyper X 3K SSD we are testing today, use compression techniques in storage whereas many others do not. This creates a bit of confusion when enthusiasts test the drive with random data through benchmarking programs such as AS SSD and Crystal Diskmark. The results seem to be lower than the listed specifications.
The results actually present a false portrayal of the drives ability when compared to other drives such as Samsung, Crucial or Intel. It is for this reason that all of our comparison testing is done through PCMark Vantage. PCMark Vantage HDD Suite simply provides evaluation results based on transfer speeds reached through typical user patterns. Vantage provides a better testing medium, in that, it sees through the typical synthetic benchmarks and provides us with true to life results of the drive.
BENCHMARK SOFTWARE
Software utilized for this review consists of ATTO Disk Benchmark, CrystalDiskMark, AS SSD, Anvil Storage Utilities, and PCMark Vantage. All do a great job of showing us the numbers that we want to see, or dont want to see in some cases, while PCMark Vantage x64 is an excellent program which recreates tests that mimic the average users activity, all the while providing a medium to measure each.
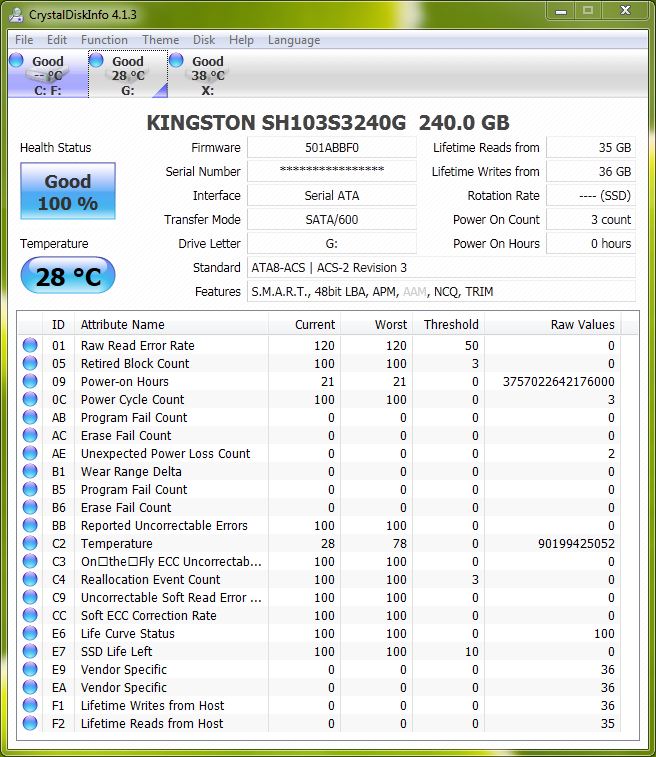 The HyperX 3K has exactly the same SMART data as other SandForce-2281 drives. Of most interest are the host writes (Attribute F1) and raw NAND writes (Attribute E9). Comparing these two numbers can help give a user an idea of how compression-friendly his or her workload is. When raw writes are less than host writes, SandForce compression is keeping apparent write amplification below 1.00. No other controller is capable of doing this.
ATTO Disk Benchmark is perhaps one of the oldest benchmarks going and is definitely the main staple for manufacturer performance specifications. ATTO uses RAW data, which removes the file system overhead. For our benchmarks, we use a set length of 256mb and test both the read and write performance of various transfer sizes ranging from 0.5 to 8192kb. Manufacturers prefer this method of testing as it deals with zero-fill data rather than random and shows better performance than benchmarks which operate through the file system.
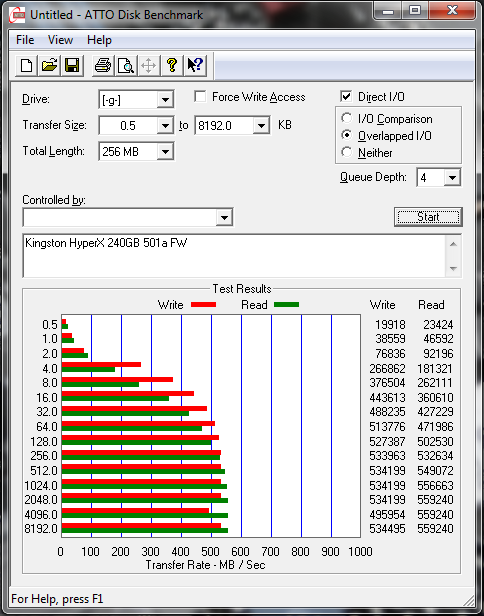 The HyperX lives up to it’s billing in this benchmark. ATTO writes a queue depth of 4 and does so in way to emulate a drive without a file system to add overhead. The performance of 546MB/s read and 521MB/s write is actually just under, and over, specifications.
my kingston sh103s3120g temperature is always at 45C. it’s that ok?i use it in a laptop.