
ATTO Disk Benchmark is perhaps one of the oldest benchmarks going and is definitely the main staple for manufacturer performance specifications. ATTO uses RAW or compressible data and, for our benchmarks, we use a set length of 256mb and test both the read and write performance of various transfer sizes ranging from 0.5 to 8192kb. Manufacturers prefer this method of testing as it deals with raw (compressible) data rather than random (includes incompressible data) which, although more realistic, results in lower performance results.
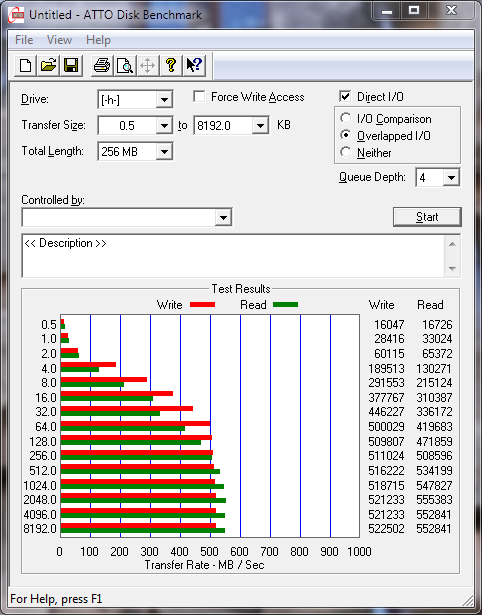
Listed specs of 560MB/s read and 530MB/s write are just a bit higher than our results of 555MB/s read and 522MB/s write performance, however, this is very minimal.
CRYSTAL DISK BENCHMARK VER. 3.0 X64
Crystal Disk Benchmark is used to measure read and write performance through sampling of highly compressible data (oFill/1Fill), or random data which is, for the most part, incompressible. We have provided the results of testing in highly compressible data on the left and that of highly incompressible data on the right.
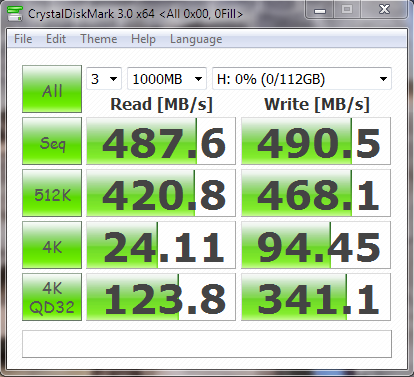
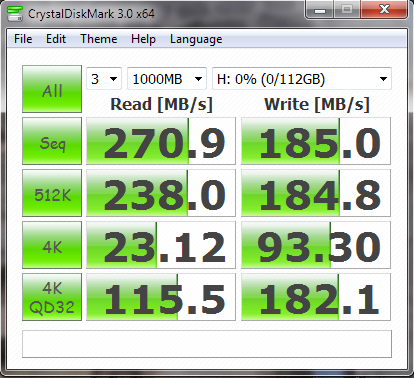 These two results are an ideal depiction of the difference in testing with compressible and incompressible data. As lower capacity SSDs are also typically lower in performance than that of higher capacity, the result on the right is actually lower than we might see in a 240GB version of this SSD.
Up until recently, AS SSD was the only benchmark created specifically for SSD testing and it uses incompressible data. AS SSD, for the most part, gives us the ‘worst case scenario’ in SSD transfer speeds because of its use of incompressible data and many enthusiasts like to AS SSD for their needs. Transfer speeds are displayed on the left with IOPS results on the right.
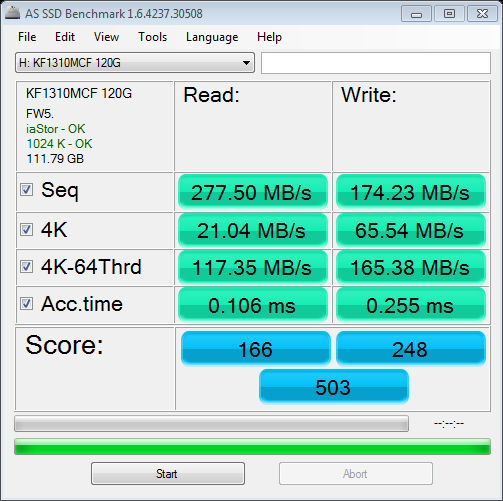
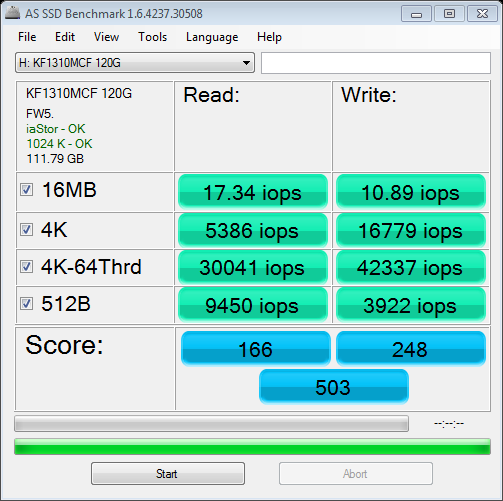 As AS SSD tests in only incompressible data, we can see that it closely matches that of the Crystal DiskMark result on the right. 4K IOPS are also the result of a lower capacity drive being tested with incompressible data. Our testing with Anvil Storage Utilities should display a result closer to listed specifications.
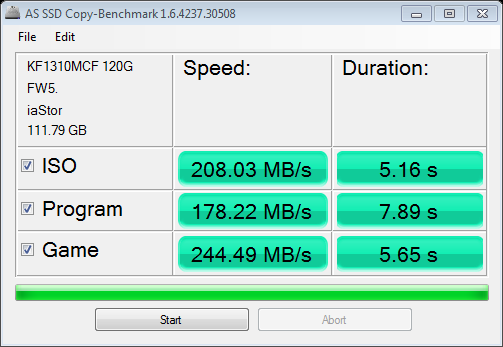
Displaying the difference in performance between lower and high capacity SSDs could not be clearer than this example. Typically, we would see SATA 3 speeds and transfer times below 4 seconds with todays SSDs utilizing the SF-2281 processor and synchronous/Toggle Mode memory.