
The SSD Review uses benchmark software called PCMark Vantage x64 HDD Suite to create testing scenarios that might be used in the typical user experience. There are eight tests in all and the tests performed record the speed of data movement in MB/s to which they are then given a numerical score after all of the tests are complete. The simulations are as follows:
- Windows Defender In Use
- Streaming Data from storage in games such as Alan Wake which allows for massive worlds and riveting non-stop action
- Importing digital photos into Windows Photo Gallery
- Starting the Vista Operating System
- Home Video editing with Movie Maker which can be very time consuming
- Media Center which can handle video recording, time shifting and streaming from Windows media center to an extender such as Xbox
- Cataloging a music library
- Starting applications
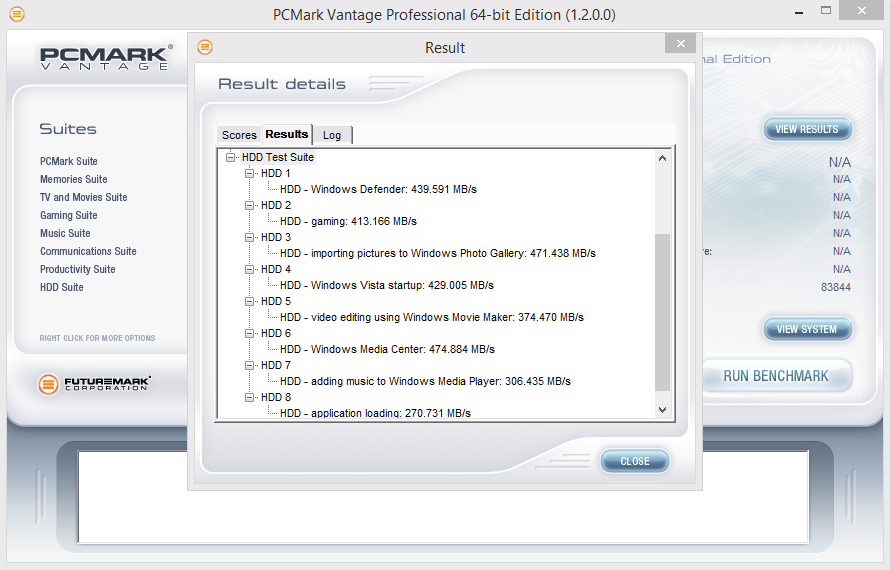
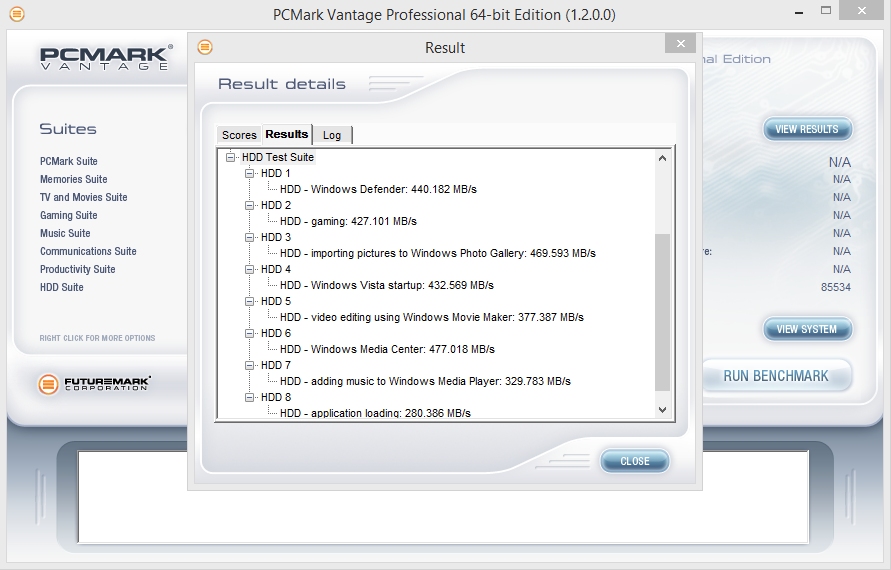
PCMARK VANTAGE RESULTS
In PCMark Vantage, both capacities performed very well. The Crucial MX200 500GB (results pictured left) achieved a Total Score of 83,844 points with a high transfer speed of 475MB/s during the Windows Media Center phase. The Crucial MX200 1TB achieved a Total Score of 85,534 points with a high transfer speed of 477MB/s during the Windows Media Center phase as well. The application loading benchmark results was the lowest with both SSDs reaching 271MB/s and 280MB/s respectively.
For our last benchmark, we have decided to use PCMark 8 Extended Storage Workload in order to determine steady state throughput of the SSD. This software is the longest in our battery of tests and takes just under 18 hours per SSD. As this is a specialized component of PCMark 8 Professional, its final result is void of any colorful graphs or charts typical of the normal online results and deciphering the resulting excel file into an easily understood result takes several more hours.
There are 18 phases of testing throughout the entire run, 8 runs of the Degradation Phase, 5 runs of the Steady State Phase and 5 runs of the Recovery Phase. In each phase, several performance tests are run of 10 different software programs; Adobe After Effects, Illustrator, InDesign, Photoshop Heavy and Photoshop Light, Microsoft Excel, PowerPoint and Word, as well as Battlefield 3 and World of Warcraft to cover the gaming element.
- PRECONDITIONING -The entire SSD is filled twice sequentially with random data of a 128KB file size. The second run accounts for overprovisioning that would have escaped the first;
- DEGRADATION PHASE – The SSD is hit with random writes of between 4KB and 1MB for 10 minutes and then a single pass performance test is done of each application. The cycle is repeated 8 times, and with each time, the duration of random writes increases by 5 minutes;
- STEADY STATE PHASE – The drive is hit with random writes of between 4KB and 1MB for 45 minutes before each application is put through a performance test. This process is repeated 5 times;
- RECOVERY PHASE – The SSD is allowed to idle for 5 minutes before and between performance tests of all applications. This is repeated 5 times which accounts for garbage collection; and
- CLEANUP – The entire SSD is written with zero data at a write size of 128KB
In reading the results, the Degrade and Steady State phases represent heavy workload testing while the recovery phase represents typical consumer light workload testing.
As you can see, performance is recorded in terms of Bandwidth and Latency. Bandwidth (or throughput) represents the total throughput the drive is able to sustain during the tests during each phase. Latency, at least for the purposes of PCMark 8, takes on a different outlook and for this, we will term it ‘Total Storage Latency’. Typically, latency has been addressed as the time it takes for a command to be executed, or rather, the time from when the last command completed to the time that the next command started. This is shown below as ‘Average Latency’.
PCMark 8 provides a slightly different measurement, however, that we are terming as ‘Total Storage Latency’. This is represented as being the period from the time the last command was completed, until the time it took to complete the next task; the difference of course being that the execution of that task is included in ‘Total Storage Latency’. For both latency graphs, the same still exists where the lower the latency, the faster the responsiveness of the system will be. While both latency charts look very similar, the scale puts into perspective how just a few milliseconds can increase the length of time to complete multiple workloads.
For a more in-depth look into Latency, Bandwidth, and IOPS check out our primer article on them here.
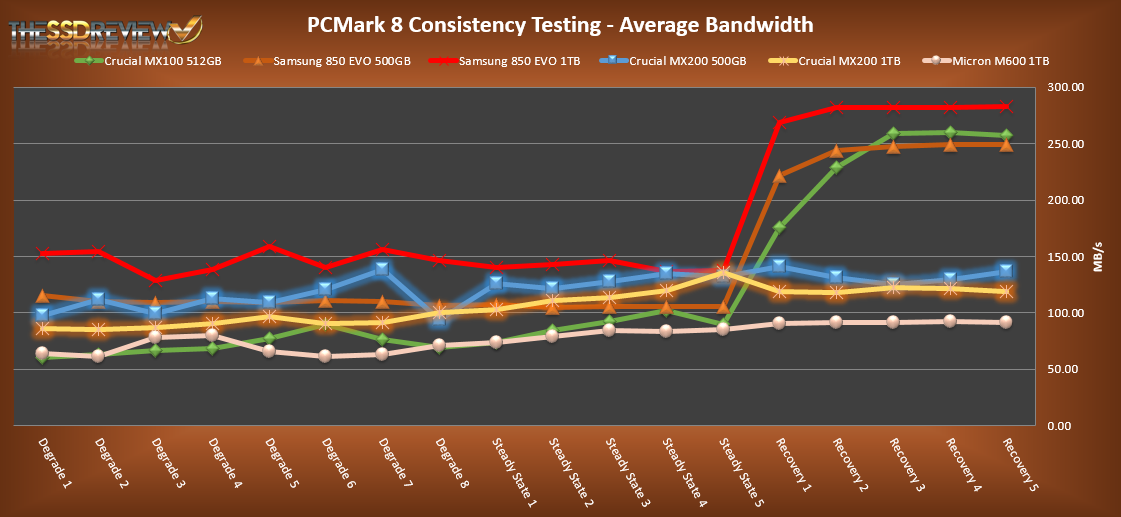
AVERAGE BANDWIDTH (OR THROUGHPUT)
These results show the total average bandwidth across all tests in the 18 phases. In this graph the higher the result the better.
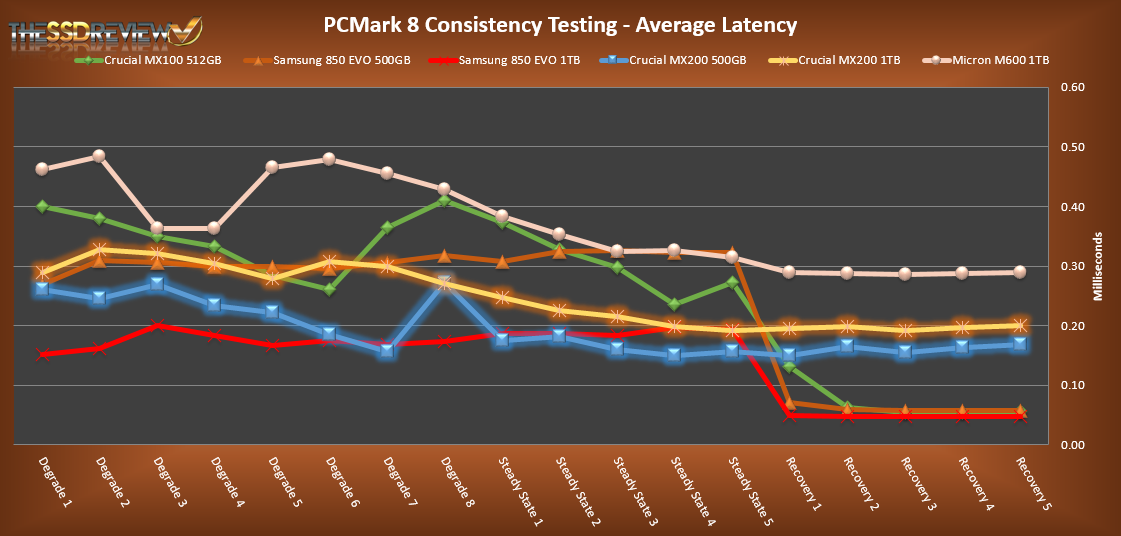
AVERAGE LATENCY (OR ACCESS TIME)
These results show the average access time during the workloads across all tests in the 18 phases. In this graph the lower the result the better.
TOTAL STORAGE LATENCY
These results show the total access time across all tests in the 18 phases. In this graph the lower the result the better.
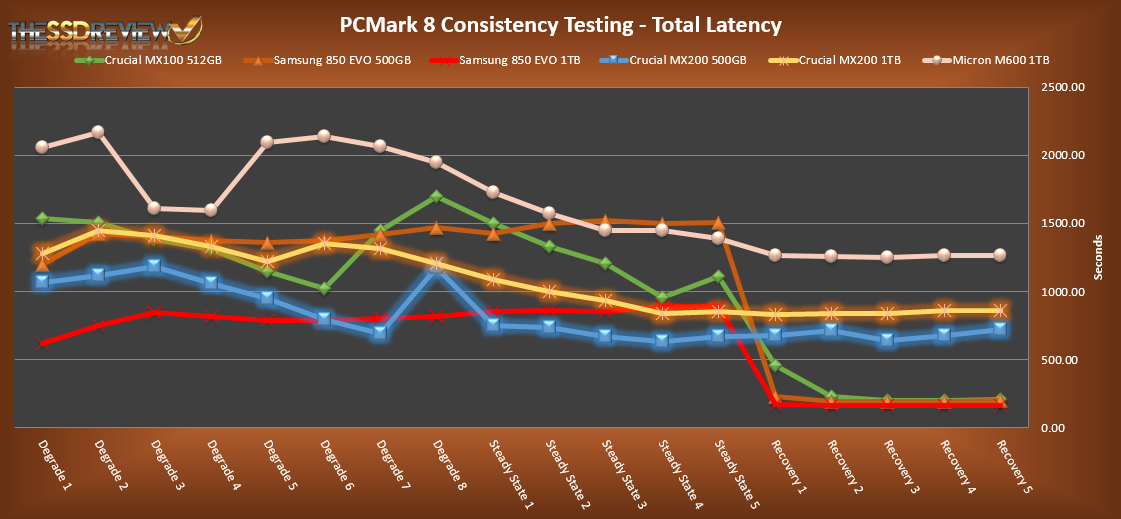
Up until now, the MX200’s performance has been great. High marks in all of our synthetic tests and both achieved over 80K points in PCMark Vantage. Now, we can also see that PCMark 8 performance has improved considerably over their older brother of a SSD, the M600. However, this improved performance is two sided. While we can see better heavy workload numbers, during the light workload phase the MX200 actually performs much worse than the MX100 and competition. The average bandwidth hovers around the 130-140MB/s mark for both Crucial MX200s while the rest maintain around 250MB/s. Again, when looking at the latency results, the average and total latency is about 3-4x greater than that of the MX100 and competition during light workloads.
It is obvious that you do not always need the 7mm to 9.5mm spacer. When is a spacer typically necessary? I just replaced two 9.5mm drives with 7mm drives; neither 7mm drive came with a spacer and neither needed a spacer. Micron kind of says the spacer is included so you will have it if you need it.
Jim
Older notebooks require the spacer in order to secure th SSD properly.
Thank you!
The spacer is definitely needed with many laptops. Older Dells, for instance.
Thanks!
Jim
Mark and Les-
Do the older ones that need spacers not have screw mounts? My newer Acer netbook (screw mount) came with a 9.5mm but its maintenance guide said it would take either one. My older Acer notebook (screw mount) came with a 9.5mm but its maintenance guide specified 9.5mm; it predated the 7.5mm so I tried the 7mm and it worked fine. I wonder if the spacer is needed for things like external USB drive cases that do not actually have screws holding the drive.
Jim
My older toshiba was a screw-less 9.5mm. It actually used the bottom cover to hold in the drive. Without the spacer, the SSD would just flop up and down. Not good.
Thanks!
Hey Les, long time reader (love the site). Quick question-most of my reading is done to determine which SSDs can help us most in HD video capture & transfer (raw uncompressed). We typically use the Blackmagic Speed Test to determine where a SSD stands before buying. Which of the test that you guys typically run gives me the closest indication to the Blackmagic test? (i.e. which will let me know best how the SSD performs under the test of raw uncompressed data) Thanks 🙂
If you are looking for a benchmark, I would have to say AS SSD is the quick and easy way to test and it is free.
So if you were deciding between the M550 and the MX200 (in 500gb form), which would be the better choice? Assume prices are either exactly the same or not a factor in the decision.
I am with the MX200. Either way, don’t hesitate to follow our links; every little bit helps.
If 850EVO happens to be around the same price as those two, its worth checking that out too.
5 year warranty is great if things go south 🙂
Finally, Crucial has released a firmware update to address the problems with the MX100 drives. I haven’t been successful yet in applying the update, as is noted by many on their forum, but I thought it would be good to post the info here (since I decided to get two MX100’s as a result of the review on this site):
https://forum.crucial.com/t5/Crucial-SSDs/Feedback-Thread-Firmware-MU02-for-MX100/td-p/165974
Sean why don’t the MX200 recover in the PCMark 8 test????
Is this deferred GC or are we stuck with those low speeds????
Those are the speeds it produced going through the test. Due to the firmware it doesn’t seem that it is able to recover quick enough to perform better in the light workloads within the time frame. However, wasn’t developed to deal with constant writes such as are issued out in the PCMark 8 consistency test, thus it doesn’t do too well in it. Our run in PCMark Vantage shows that it does perform a lot better if it isn’t constantly strained. So real world you shouldn’t have much to worry about.
Nice review. Here is a comparison with Crucial M552! Which is the best ?
https://www.techwarn.com/crucial-mx200-vs-m550-review/
Nice Piece of information for the concerned people