
SERVER PROFILES CONTINUED
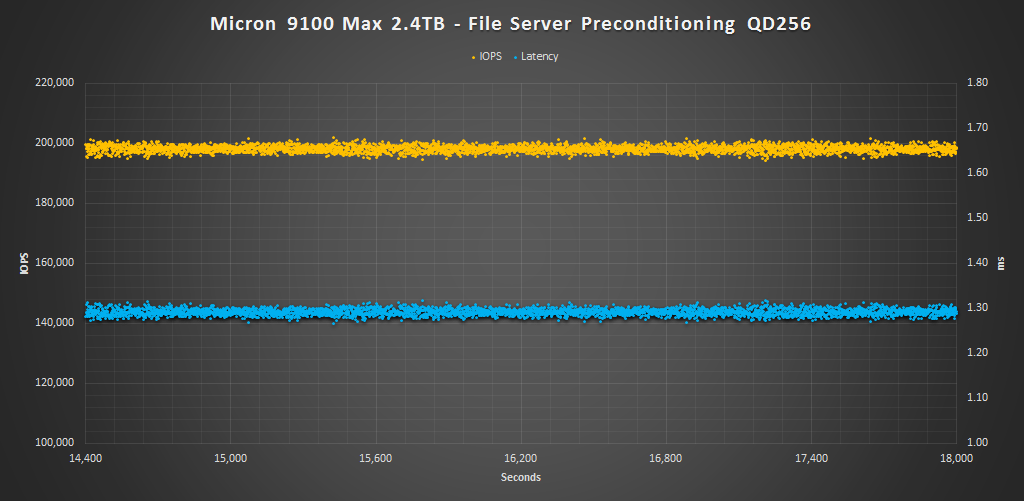
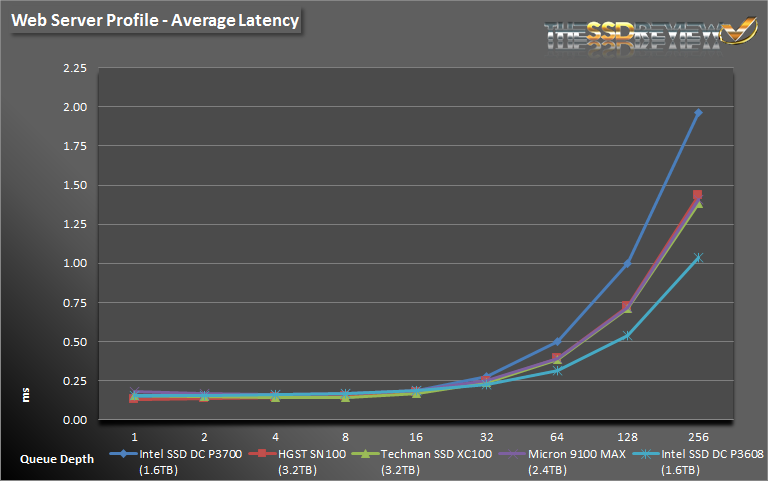
Our last set of profiles include File Server and Web Server workloads. As mentioned before the last hour of preconditioning, the average IOPS, and average latency for each QD is graphed below.
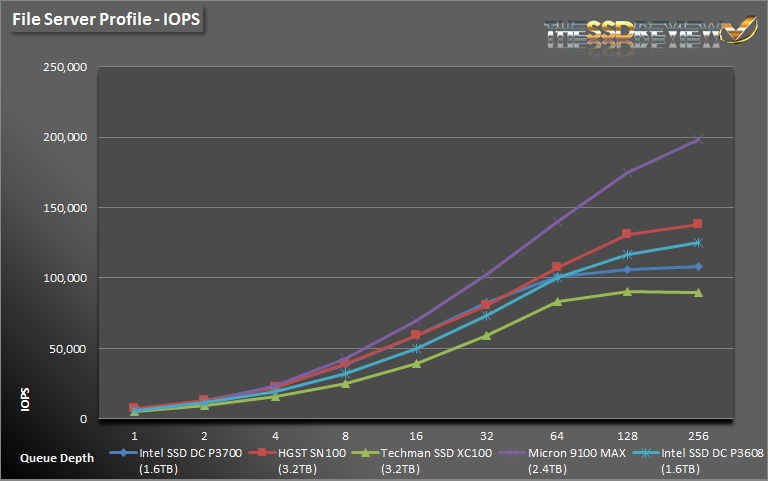
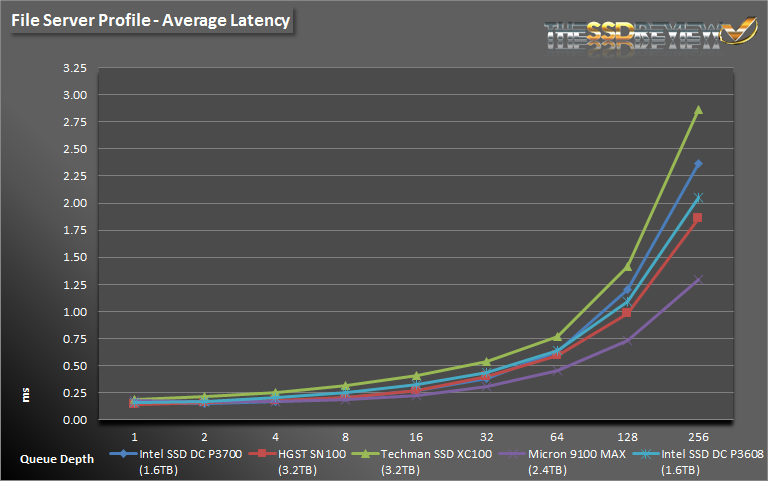
The File Server profile is based on an 80% read/20% write mix. It’s made up of block sizes from 512 to 64K, each making up a different percentage of the access pattern. The pattern is: 512 bytes=10%, 1k=5%, 2k=5%, 4k=60%, 8k=2%, 16k=4%, 32k=4%, 64k=10%.
During the File Server benchmark we can see very similar performance to that of our Email Server results, only now the results are a bit higher. Under this mixed workload the Micron 9100 MAX takes the lead from QD4 on up and leaves all the other drives in the dust.
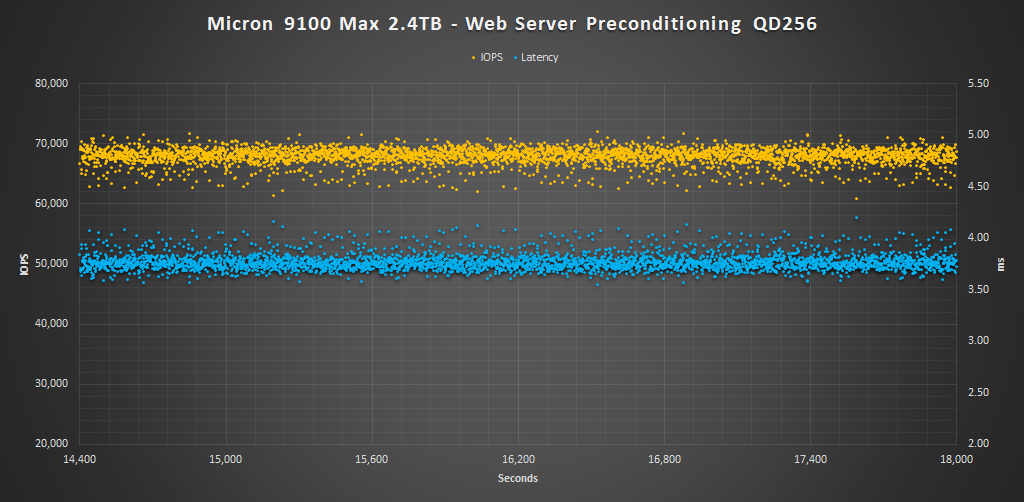
The Web Server profile is similar to the File Server profile, but has some additional 128K and 512K accesses thrown in for good measure. Additionally, the profile is 100% reads.
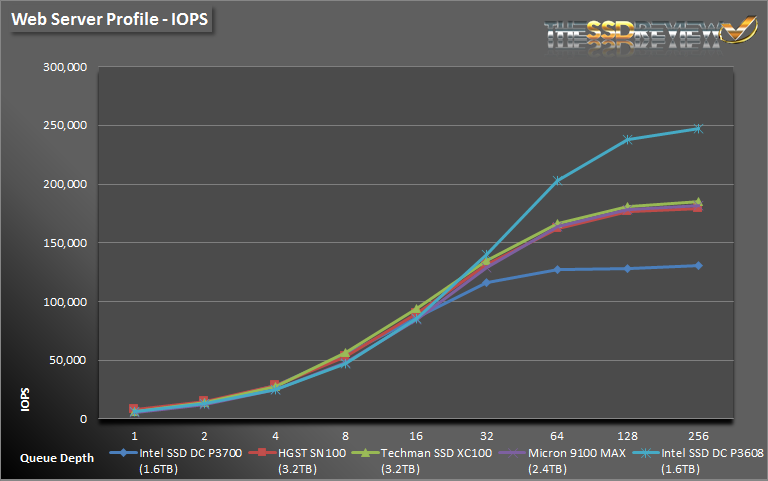
For the Web Server benchmark, because it is 100% read performance, we can see that the Intel DC P3608 takes the lead, but not until QD32. From QD1-32 the HGST SN100 and Techman XC100 both deliver slightly better performance, but from QD64-256 the 9100 MAX overtakes the HGST SN100.