
8KB RANDOM READ/WRITE
To measure 8KB random read/write performance do the same preconditioning as we did for 4KB performance. The drive is first secure erased to get it in a clean state. Next, the drive is filled by sequentially writing to the RAW NAND capacity twice. We then precondition the drive with 8KB random writes at QD256 until the drive is in a steady state. Finally, we cycle through QD1-256 for 5 minutes each for writes and then reads. All this is scripted to run with no breaks in between. The last hour of preconditioning, the average IOPS, and average latency for each QD is graphed below.
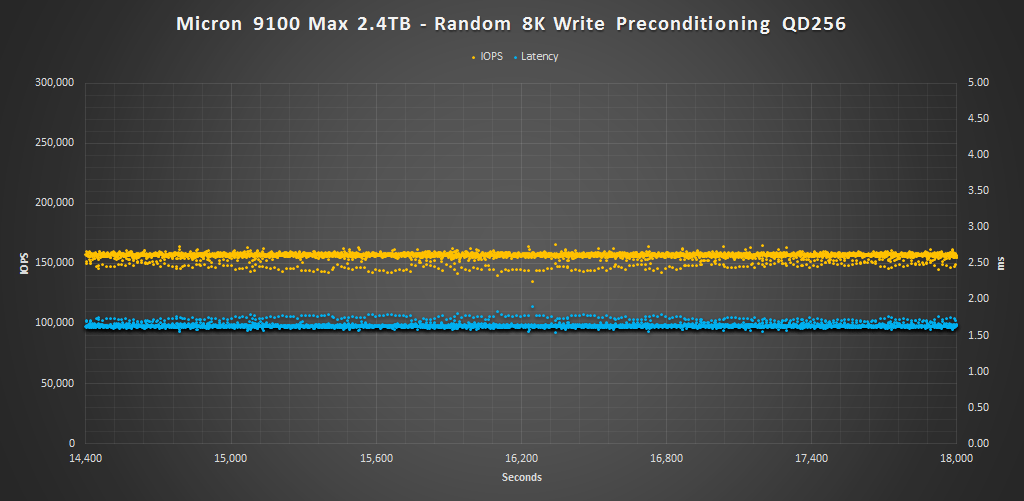
Here we can see that the 8K results, just as the 4K results, follow a very tight consistency pattern for the majority of the final hour of preconditioning. The 9100 MAX averages 156K IOPS at with an average latency of 1.59ms. The performance distribution ranges from about 140K to 160K IOPS. Latency mainly ranges from 1.5 to 1.7ms as well.
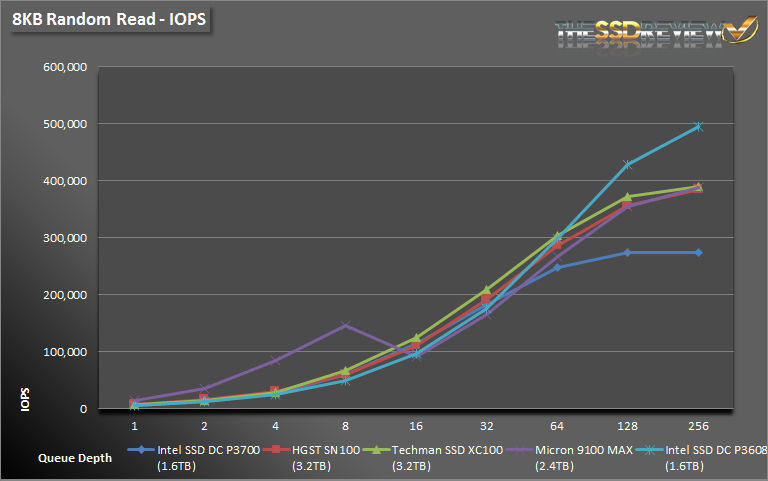
During the lower QD1-QD8 portions of this test the 9100 MAX shows a very strong lead over the competition, however, at QD16 and up performance drops to below that of the Techman XC100 and SN100 until QD256. At QD64 to 256 we can see that the dual controller DC P3608 also takes the lead again.
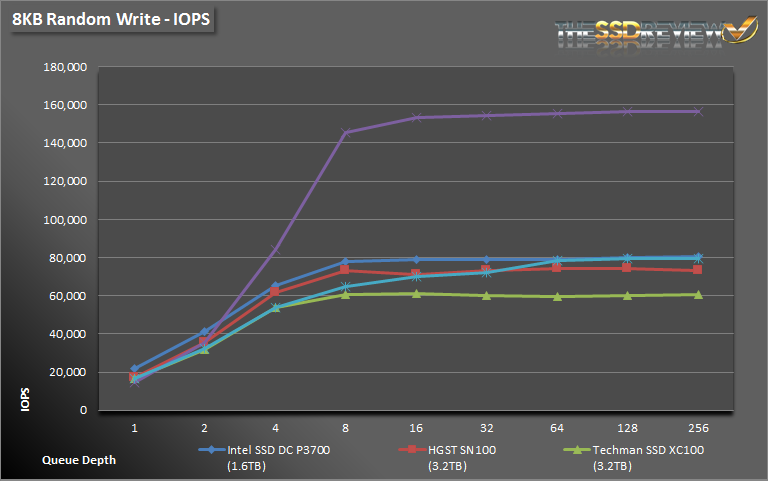
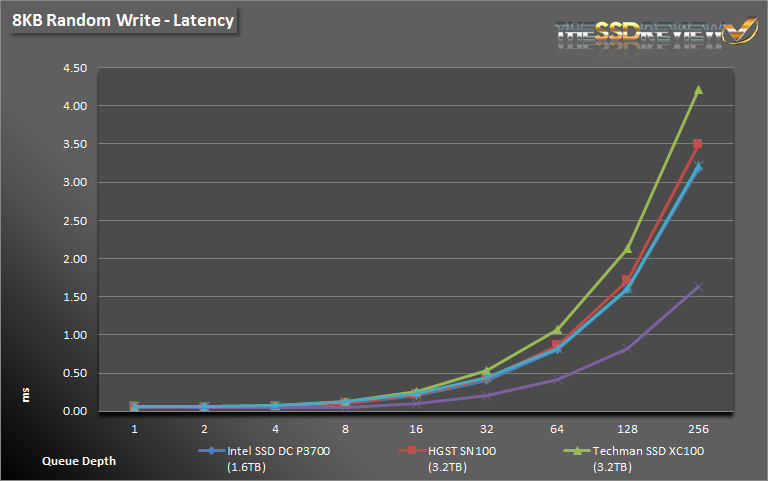
QD1-2 writes prove yet again to be a weak point when compared to our other test drives, however, it quickly makes up for it from QD4 on up. The 9100 MAX reaches nearly 160K IOPS when 8K writes are thrown at it and latency just passes the 1.5ms mark at QD256 as well.