
SERVER PROFILES
While synthetic 100% read or 100% write workloads do a great job of testing the underlying technology and reporting easy to understand results, they aren’t always indicative of how the drive will be used by the end user. Workloads that simulate enterprise environments try to bridge that gap without being overly complex. The process of measuring our server workload performance is the same as measuring random. The drive is first secure erased to get it in a clean state. Next, the drive is filled by sequentially writing to the RAW NAND capacity twice. We then precondition the drive with respective server workload at QD256 until the drive is in a steady state. Finally, we cycle through QD1-256 for 5 minutes each measuring performance. All this is scripted to run with no breaks in between. The last hour of our preconditioning, the average IOPS, and average latency for each QD is graphed below.
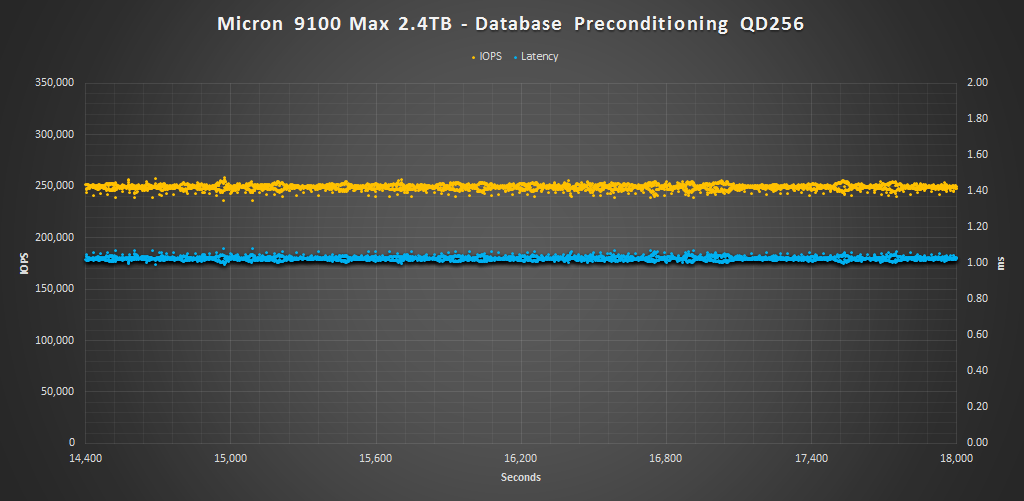
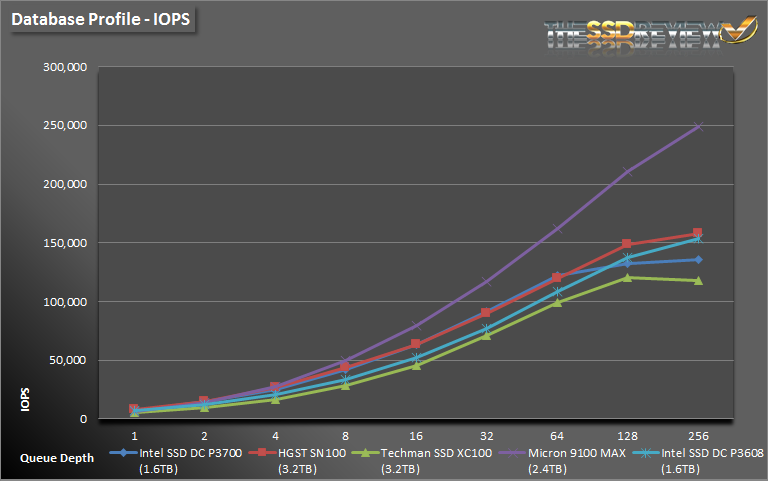
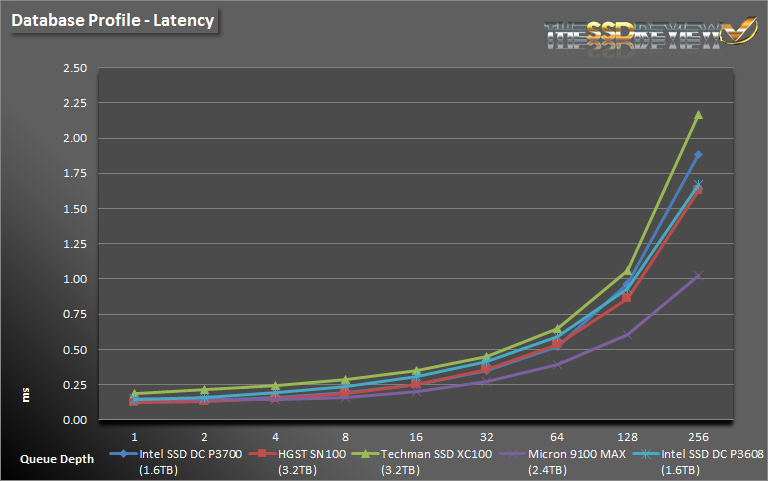
The Database profile is 8K transfers, and 67% percent of operations are reads.
Here we can see that the 9100 MAX is just a beast during the database workload. From QD4 and up it demolishes the competition thanks to its very strong random write performance. Latency peaks just above 1ms during QD256, which is very low as you can see.
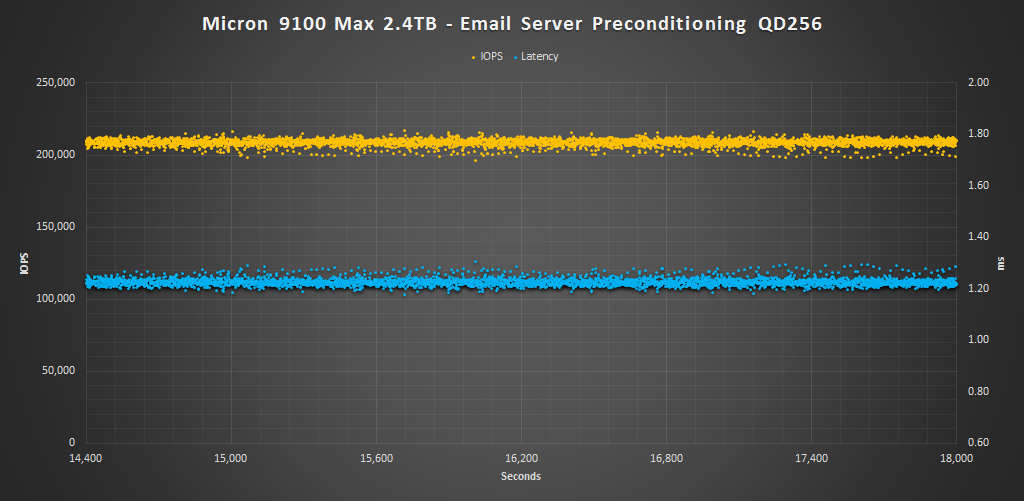
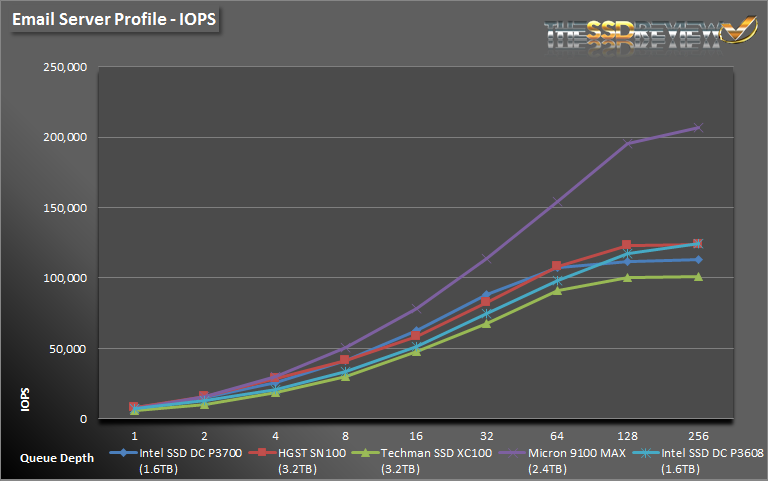
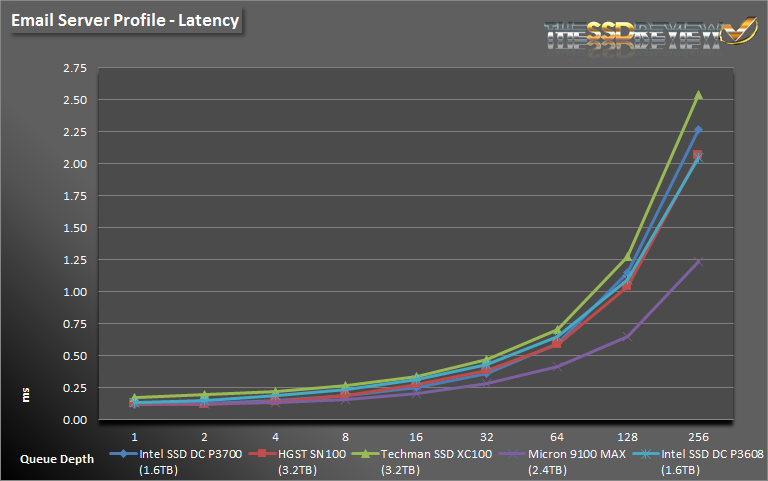
The Email Server profile is similar to the Database profile, only it 8K transfers at 50% reads and 50% writes.
Again, the email server profile shows similar results with the 9100 MAX taking the lead by a decent margin after QD4. Latency is a bit higher than the database workload, but still remains under 1.25ms at QD256.