
One of the hardest situations to simulate with IOmeter is the acceleration of arrays with rapidly changing data in a caching scenario. Writing test files to a Base Array with a CacheCade Pro Volume enabled resulted in a very quick pace of acceleration. Once the test file is written in its entirety, the ramp is almost instantaneous. What we are looking to illustrate is the performance on arrays such as Web Servers, File Servers and OLTP. These arrays can have “Hot” data that changes constantly. This can lead to performance variability in real time which is largely related to the performance of the caching algorithms. It all comes down to how effectively the data is cached and then, to simulate this somewhat, we created a test file on the Base Array (HDD) without any caching enabled. From there, we configured the CacheCade VD and enabled the read write caching and then configured a “simple” test for the controller; a ‘single zone’ of data being written and read from the controller.
We used an 80/20 Read/Write mix, which is a standard database loading. We selected 100 percent 4K random access (aligned) to simulate the most demanding small file access with a Queue Depth of 128 for one worker. Creating a 20GB test file, we ran these tests to show how the program can detect “Hot” data and adjust to caching that information dynamically. The settings for the Base Array of HDD were: No Read Ahead, Direct I/O, Write Through, and Drive Cache Disabled with a SS64KB. The CacheCade Pro VD was set to Write Back mode.
For this test we also included a third EFD (Enterprise Flash Device) to illustrate the ceiling of performance with the controller. When the upgrade is provided that will allow the 9265 the same write caching, I would suspect this ceiling will rise quite a bit. Regardless, this is an impressive acceleration of an HDD Base Volume!
A click will bring the graph up to full scale.
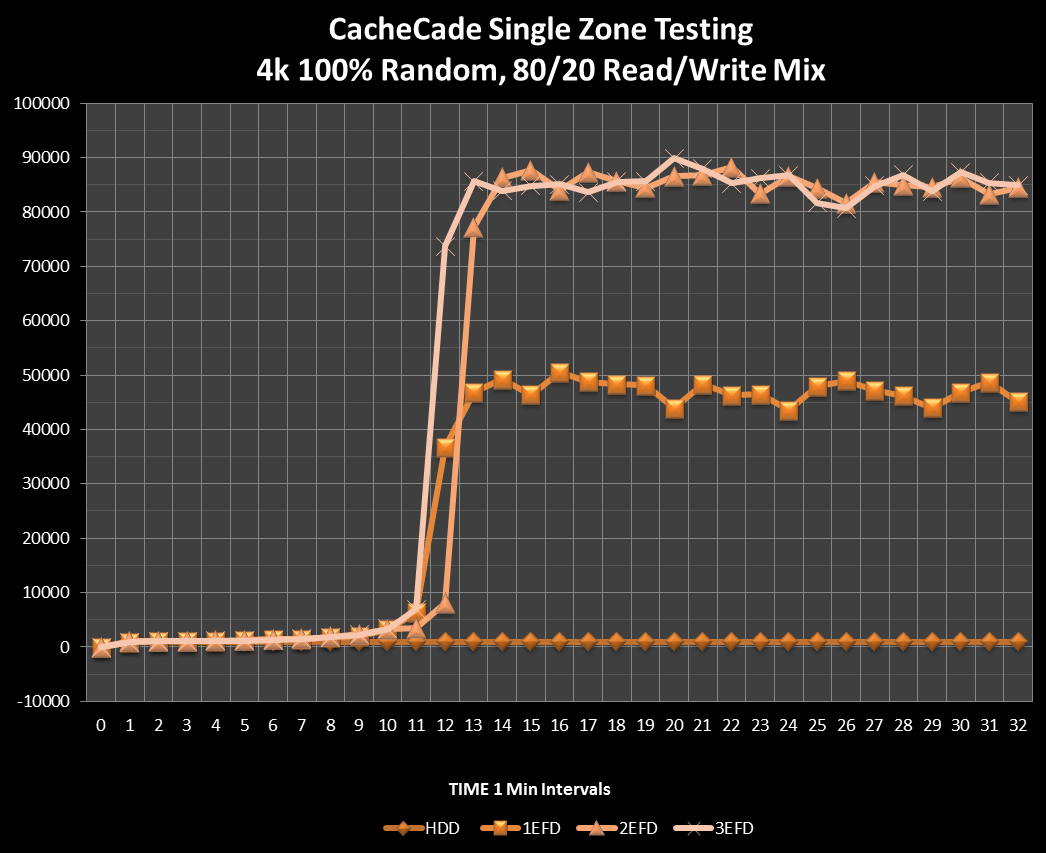 A key point here is that this is performance from the starting gun. Once the test is loaded the controller has no idea which data is hot and in need of caching. It has to intelligently adjust and begin caching. As time goes on the system will perform much better, as the algorithm identifies patterns and adjusts.
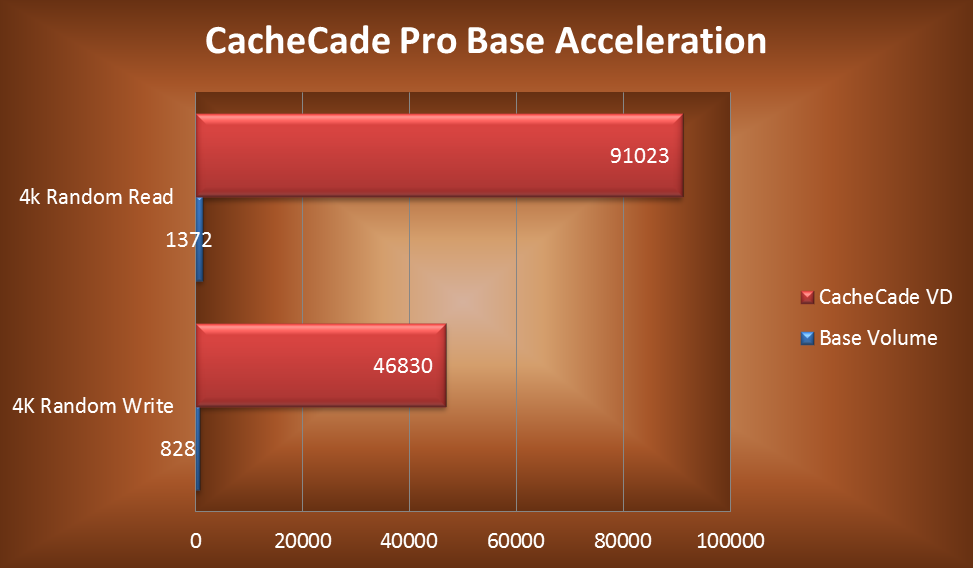
BASE ACCELERATION RESULTS
The configuration of this test scenario is simplicity at its finest; the most basic test that we could conjure. Here we will compare acceleration of 4K random access from a CacheCade 2.0 accelerated volume vs a ‘naked’ base array with no caching. These results are for 100 percent random read and 100 percent random write (4k aligned). Conducted at a QD of 128, these tests are intended simply to push basic configurations. The CacheCade Volume was first created with 3 Lightnings in RAID-0, and then a test file of 20GB was used for testing. The settings for the Base Array of HDD were; No Read Ahead, Direct I/O, Write Through, and Drive Cache Disabled with a SS64KB. The CacheCade Pro VD was set to Write Back mode. Note that the size of the test file did fit entirely on the flash layer. As you can see here the results are phenomenal.
NEXT: Multiple Zone Results
~ Introduction ~ Basic Concepts and Application ~
~ Enter Write Caching ~ Exploring TCO ~ Test Bench and Protocol ~
~ Single Zone Results ~ Overlapped Region Results ~
~ Real World Results and Conclusion ~
can you please put labels on your damn graphs? would be helpful.