
SNIA PTS-E IOPS TESTING
The Storage Networking Industry Association has an entire industry accepted performance test specification for solid state storage devices. Some of the tests are complicated to perform, but they allow us to look at some important performance metrics in a standard, objective way. Click to enlarge!
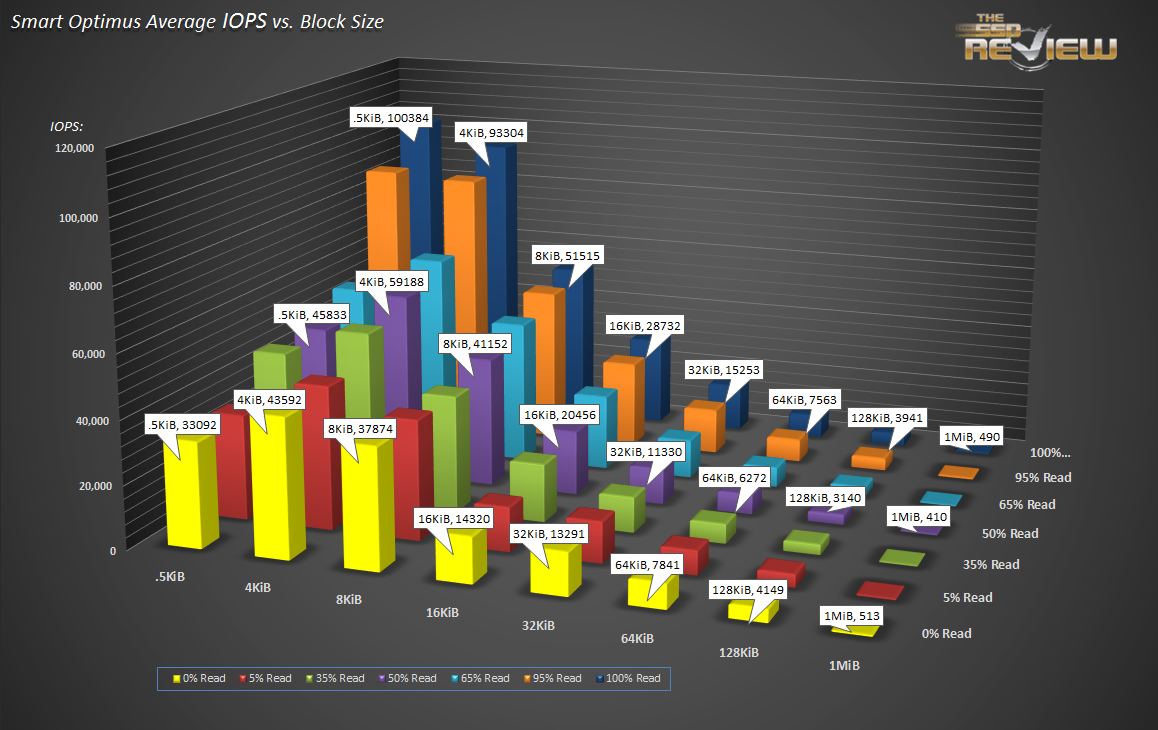 SNIA’s performance test specifications include IOPS testing, but it’s not quite what you’re expecting. It’s composed of 25 rounds of testing, each round taking 56 minutes to complete. We measure IOPS at 8 different block sizes (512 bytes through 1 MB) at 7 different read/write mixes. From 100% read to 0% read (that’s 100% write) and five more mixes in between. Once the 25 rounds are finished (at just under 24 hours), we evaluate the average performance of four of the 25 rounds once steady state is achieved. In the Optimus’ case, performance doesn’t change much from round one to round twenty-five. We can look at the resulting data in different ways, but the column chart you see above is a great indicator of performance. You can take a closer look at the above graph by clicking on it. 100% read is at the top, 100% write is at the bottom. Block sizes increase from 512 bytes on the left to 1MB on the right. It’s a lot to take in, but the results of this one test can predict the way the drive performs in just about every other test.
As you can see, drives almost never get exposed to only reads or only writes. They’re always doing some of both. So looking at just 100% read or 100% write performance fails to tell the whole performance story.
Each of the 56 tests that compose each round are run for one minute. In the case of the SMART, it was performed over the entire drive at with 32 outstanding commands.

This is a matrix of one of the 25 rounds, in this case round 20. It’s just one slice of data, but it gives a more specific feel for what kind of random IO to expect. If you happen to know your workload is heavily dependent on 8KB accesses, and 60 to 70 percent of access are reads, you can see whether a drive is likely to meet your performance requirements. The Optimus manages over 45,000 8KB IOPS at a read/write mix of 65%.
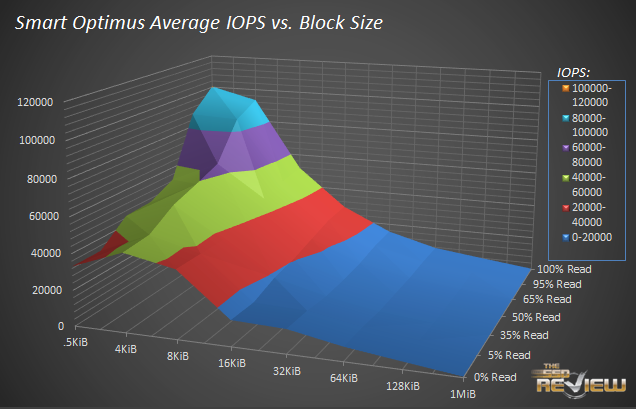
SNIA optionally calls for a surface chart. Most drives look similar to the Optimus’ chart shown above. This is primarily because of the fact that almost every drive does far better at read operation than write operations at steady state. SNIA defines steady state as the point at which the dependent variable you want to test for stops moving up or down more than 10%.
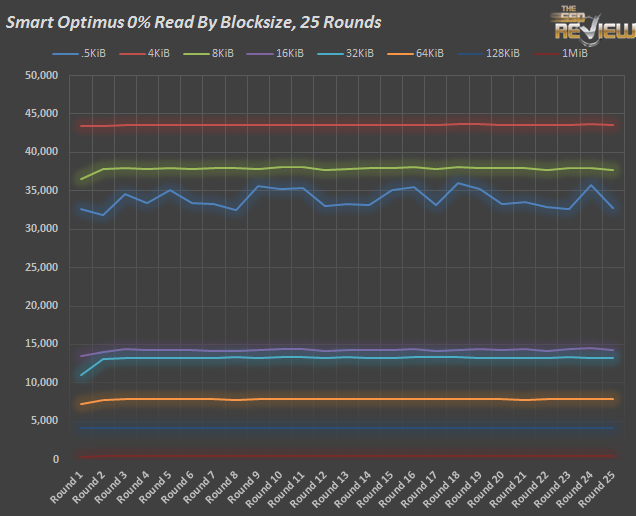
The Optimus barely moves any percent from round to round. When we look at just the 100% write IOPS over the 25 rounds, we can see the drive move into steady state. But the Optimus doesn’t play around. It doesn’t move at all. The most important line in the chart is the one at the very top, 4K writes. It doesn’t move at all over the whole 24 hours of testing. Why is that? There is another test to explain this phenomenon on the next page.
Firmware ultimately ends up being more important than the controller itself in many or most circumstances. Good FW can make a mediocre drive great, or a great drive a flaming dumpster fire.
That was beautiful, thank you for the insight. 🙂
The SSD market is RED HOT right now! Thanks Les for all the good stuff!
Reliability and predictable performance is very important. I wish consumer-oriented drives would be more like that. As a side note, what’s going on with the 12Gbps connection? Did you manage to sort it out? Perhaps it will work fine with Win7, WIn8 or Server 2012?
this is beautiful.. Wish my old kinston had the speed and reliability of this.