
LATENCY
To specifically measure latency, we use a series of 512b, 4K, and 8K measurments. Each blocksize latency is measured for 100% read, 65% read/35% write, and 100% write/0% read mixes.
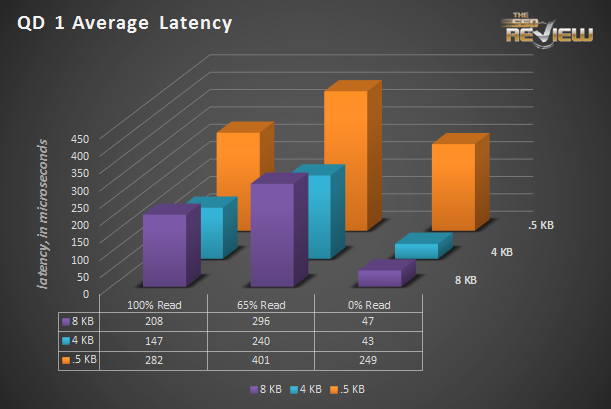
Average latency for 4K and 8K reads is good, but write latency is fantastic. The 65/35 mix is worse than the others, but mixed workloads are where many drives run into trouble. When looking at SSD performance, it’s common to see only read or write performance, but mixed performance separates the men from the boys. The 512 byte results are virtually always terribly in comparison to larger block sizes as 512 byte accesses are by their nature unaligned.

The max latency results are high, but represent only a single IO out of the multiple thousands from each test run.
ADVANCED WRITE TESTING
Because of the nature of solid state storage, once the drive gets filled, write speed takes a precipitous plunge. We can take a fresh drive and write 4K randoms to it for 300 minutes to see what happens.
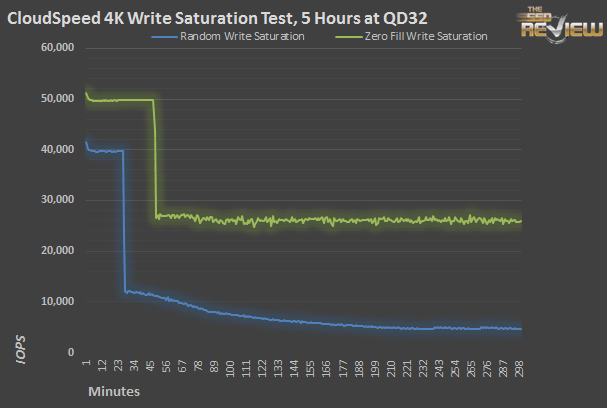
To get a feel for the write saturation performance with random and repeating data, we run the testing twice; once with zero fill data, and once with random/incompressible data.
Once the drive gets filled, speed drops quickly and suddenly. In the case of the compressible data run, performance settles in at 26,000 IOPS. SandForce’s deduplication technology pays off here, with higher initial performance and much higher performance over the five test hours. With incompressible data, performance drops much further, down to 5,000 IOPS. With additional over provisioning, average performance could be increased greatly, and that’s one of the reasons the compressible data run is so much higher; the drive is only partially full thanks to real time data compression, leaving additional free space for the drive to work with internally.
The lower performance once a drive is filled is due to write amplification. As the drive struggles to free up blocks to write to, tons of additional overhead is incurred.
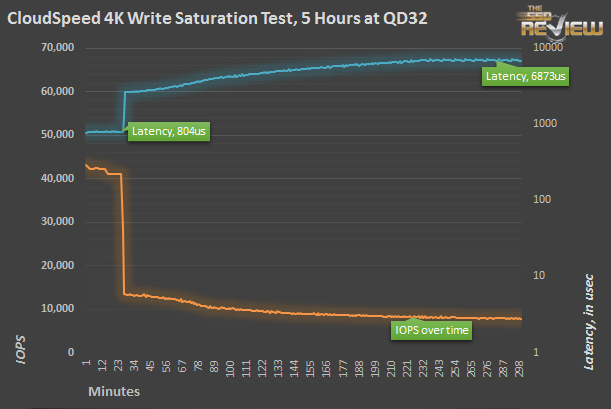
Tacking on average latency to the incompressible write saturation run lets us see the inverse relationship between latency and IOPS. Average latency starts at just over 600us, and rises to just over 800us before the drive gets full. 270 minutes later, latency has risen to nearly 7,000usec (or 7ms).
Lastly, take a look at the stability testing. Notice how the workload (70% reads/30% writes) fares over the 2400 seconds of the test. On average, the CloudSpeed manages over 53,000 IOPS, and as expected, most of the points are clustered around that average. Second by second, some results are as low as 42,000 and as high as 60,000 IOPS. When absolutely predictable performance is required from moment to moment, the more stable solution is more desirable. The CloudSpeed was surprisingly consistent.